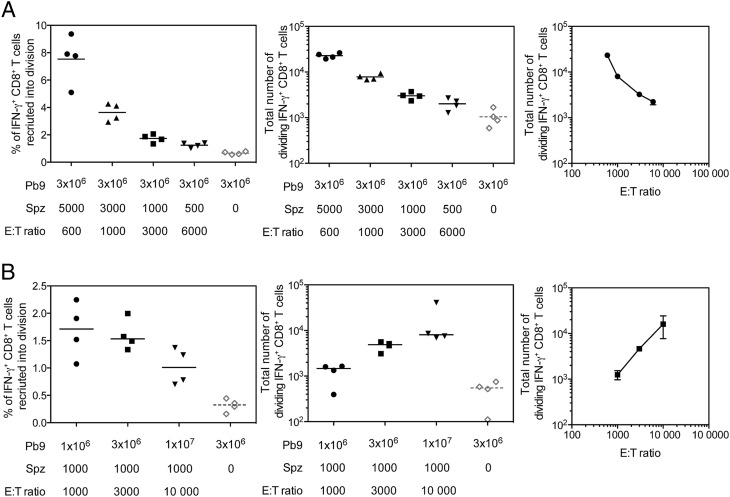
FIGURE 5.
The affect of altering E:T ratios on dividing cell numbers. (A) CFSE-labeled splenocytes (3 × 10⁶ Pb9+) from HAd5-MVA TIPeGFP–vaccinated mice were transferred into BALB/c recipient mice 1 d prior to i.v. challenge with 5000, 3000, 1000, or 500 P. berghei sporozoites. Livers were harvested 3 d later for analysis by flow cytometry. Simulated cells were surface stained with Live/Dead Aqua, CD4–eFluor 650, CD8-PerCP-Cy5.5, CD44–Alexa Fluor 700, CXCR3-allophycocyanin, and Vβ3-PE and stained intracellularly with IFN-γ–eFluor 450. Graphs represent the percentage of Pb9-specific cells that were recruited into division (left), the total number of dividing Pb9-specific CD8+ T cells present in the liver on day 3 (middle), and the total number of dividing cells versus the E:T ratio (right). Each individual animal is displayed as a single point (n = 4 per group), and the mean per group is represented by the line; data are representative of two similar experiments. (B) Pb9+ CFSE-labeled splenocytes (1 × 10⁶, 3 × 10⁶, or 1 × 10⁷) from HAd5-MVA TIPeGFP–vaccinated mice were transferred into BALB/c recipient mice 1 d prior to i.v. challenge with 1000 P. berghei sporozoites. Livers were harvested 3 d later for analysis by flow cytometry. Stimulated cells were surface stained with Live/Dead Aqua, CD4–eFluor 650, CD8-PerCP-Cy5.5, CD44-CD62L-PE-Cy7, CD127-allophycocyanin-Cy7, and CXCR3-allophycocyanin and stained intracellularly with IFN-γ–e450. Graphs represent the percentage of donor Pb9-specific cells that were recruited into division (left), the total number of dividing Pb9 specific CD8+ T cells present in the liver on day 3 (middle), and the total number of dividing cells versus the E:T ratio (right). Individual animals are displayed as single points, and the median per group is represented by the line.

