Figure 4.
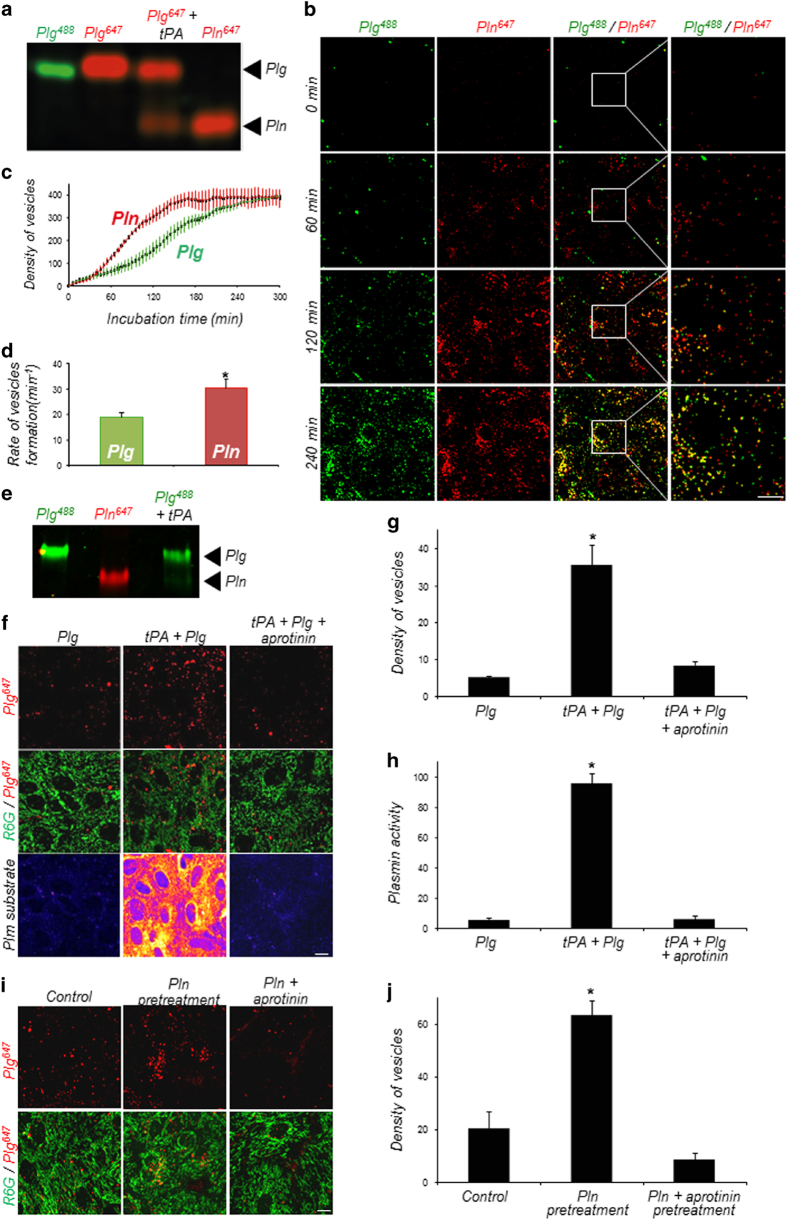
A plasmin (Pln) substrate is involved in plasminogen (Plg) and Pln uptake. (a) Electrophoretic analysis showing Plg and Pln forms present in the cell monolayer of astrocytes incubated with Alexa488-labelled Plg (Plg488), Alexa647-labelled Plg (Plg647), Alexa647-labelled Plg and tPA (Plg647+tPA, 25 nm) or Alexa647-labelled Pln (Pln647) for 1 h (n=3). (b) Time course (0–240 min) of Plg647 (25 nm, green) and Pln647 (25 nm, red) uptake in cultured astrocytes (n=3). (c) Quantification (number of vesicles/103 μm3, n=4) of Plg488 and Pln647 uptake by cultured astrocytes as a function of time (0–300 min) and (d) corresponding quantification of uptake kinetics (rate of vesicles formation per min). Graphs show means±s.e.m. (n=3). *Significantly different from ‘Plg’ condition (P<0.05). (e) Cultured astrocytes were treated with Plg488 (25 nm), Pln647 (25 nm) or Plg488 (25 nm) with recombinant tPA (10 nm) for 2 h. Then, proteins were removed with a specific washing protocol and intracellular proteins were extracted and submitted to SDS-PAGE. Alexa488 and Alexa647 fluorescence was then revealed in the gel allowing to distinguish between the Plg and the Pln forms. (f) Representative confocal images of cultured astrocytes (R6G, green) exposed to Plg647 (25 nm, red) with or without tPA (25 nm; tPA+Plg) or a combination of tPA and aprotinin (20 IU ml−1; tPA+Plg+aprotinin) for 1 h. A specific fluorescent Pln substrate was coincubated in the medium, to monitor Pln activity (n=4). (g) Corresponding quantification of density (number of vesicles/103 μm3) of fluorescent vesicles and (h) Pln substrate fluorescence intensity (arbitrary units). Graphs show means±s.e.m. (n=4). *Significantly different from ‘Plg’ condition (P<0.05). (i) Representative confocal images of Plg647 (25 nm, red) uptake in control astrocytes cultures or in astrocytes cultures pre-treated with Pln (50 nM) or with Pln and aprotinin (20 IU ml−1) for 1 h; n=4). (j) Corresponding quantification of density (number of vesicles/103 μm3) of fluorescent vesicles. Graphs show means±s.e.m. (n=4). *Significantly different from ‘control’ condition (P<0.05). Scale bars: 20 μm.

