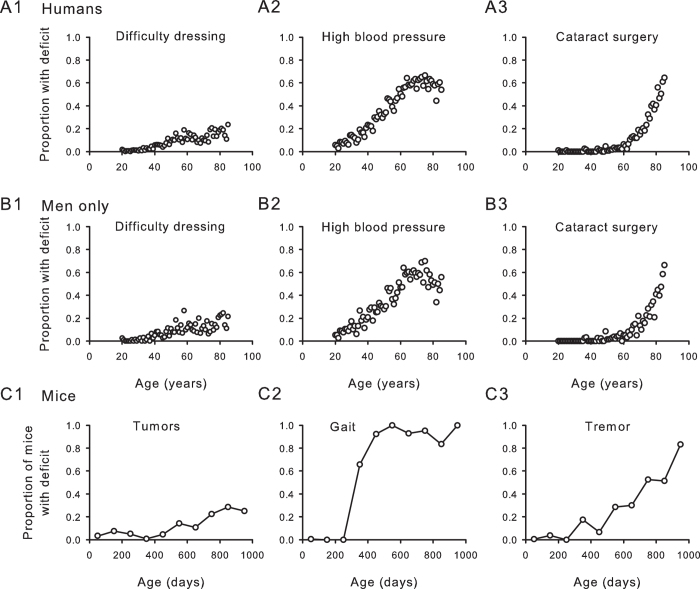
Figure 1. Individual deficits accumulate at varying rates in people and in mice.
(A) Mean scores from pooled data from men and women show examples of individual deficits that exhibit different patterns of accumulation with age (n = 9169 people). Difficulty dressing (panel 1), high blood pressure (panel 2) and cataract surgery (panel 3) accumulated at different rates over time. (B, panels 1, 2, 3) Rates of deficit accumulation were similar for men only when compared to the sample shown in A (n = 4383 men). Data were binned and averaged each year for A and B. (C, panels 1, 2, 3) Tumours (panel 1), gait (panel 2) and tremor (panel 3) are shown as examples of deficits that demonstrate different progressions with age in male mice. Longitudinal data for each deficit were obtained from the entire cohort of mice and binned in 100 day increments (n = 251 mice).

