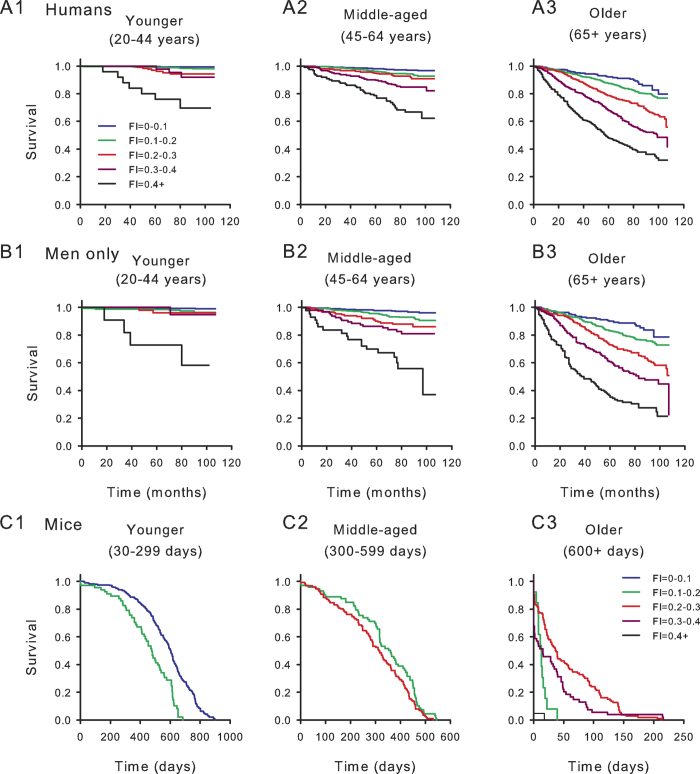
Figure 4. High frailty index (FI) scores predict mortality at all ages both in humans and in mice.
(A) Kaplan Meier survival curves stratified by 0.1 increments of the FI for younger (20–44 years; panel A1, n = 4083), middle-aged (45–64 years; panel A2, n = 2642) and older people (65+ years; panel A3, n = 2444) are illustrated. At any age, higher frailty scores were associated with reduced survival. (B) Results were similar for men, (younger, Panel B1, n = 1867, middle-aged, Panel B2, n = 1292, older, Panel B3, n = 1242) although mortality was higher in men than in the whole human sample. (C) Kaplan Meier survival curves were also constructed for younger (30–299 days; panel C1, n = 251), middle-aged (300–599 days; panel C2, n = 229) and older (600+ days; panel C3, n = 158) mice. Each mouse is represented only once in each age stratum. In general, as FI scores increased survival declined in all three age groups of mice. Mortality was high in one FI stratum in the older group (e.g. FI = 0.1–0.2). This reflected a small number of very old mice with low FI scores and severe deficits that required immediate euthanasia.

