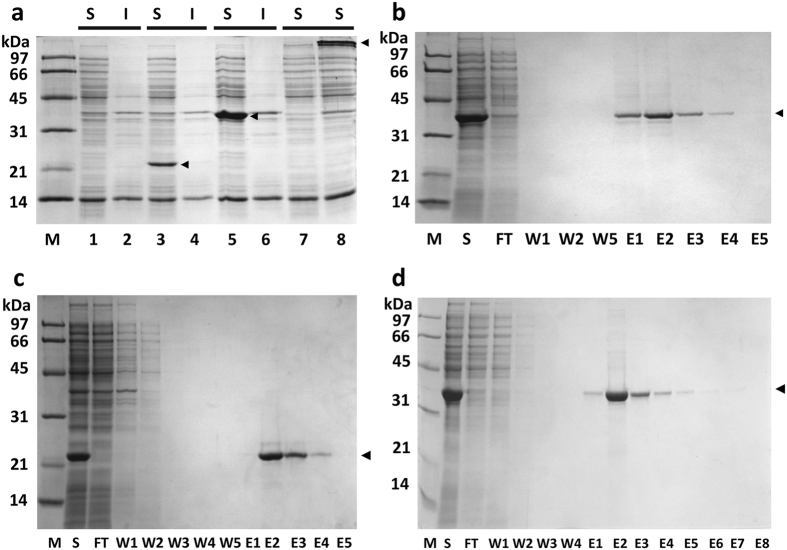
Figure 3. SDS-PAGE analysis of L-ABD(KC) and SAVSBPM18-L-ABD(KC) production and purification.
(a) Distribution of L-ABD(KC) and SAVSBPM18-L-ABD(KC) in the intracellular fractions of E. coli. Cells were disrupted by sonication. Lanes 1 and 2, negative control, E. coli BL21(DE3)[pET29B]. Lanes 3 and 4, samples from the L-ABD(KC) production strain. Lanes 5 and 6, samples from the SAVSBPM18-L-ABD(KC) production strain. All samples in lanes 1–6 were boiled before loading onto an SDS-polyacrylamide gel. Lanes 7 and 8, samples were unboiled. Lane 7, negative control; lane 8, SAVSBPM18-L-ABD(KC). Arrowheads mark the positions of L-ABD(KC) and SAVSBPM18-L-ABD(KC). (b) Affinity purification of SAVSBPM18-L-ABD(KC) by biotin agarose. Arrowhead marks the position of SAVSBPM18-L-ABD(KC). (c) Purification of L-ABD(KC) by Sepharose 6B-CL. Arrowhead marks the position of L-ABD(KC). (d) Affinity purification of SAVSBPM18-L-ABD(KC) by Sepharose 6B-CL. Arrowhead marks the position of SAVSBPM18-L-ABD(KC). M, molecular weight marker; S, soluble fraction; I, insoluble fraction; FT, flow-through fraction; W, wash fractions; E, elution fractions.

