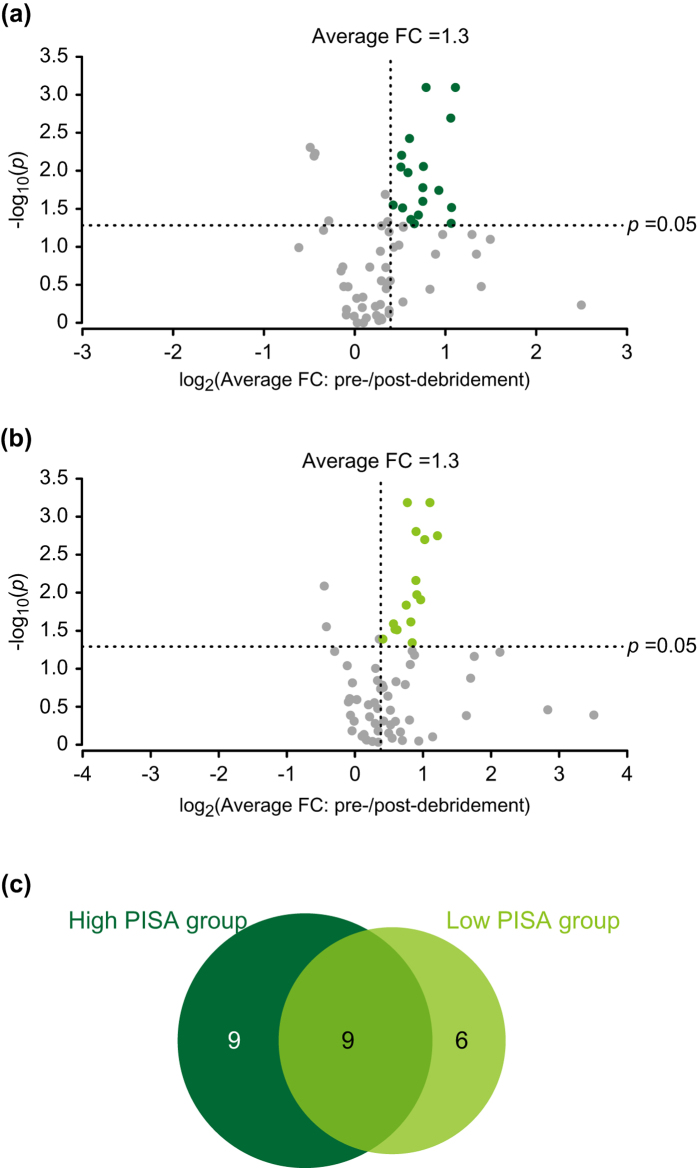
Figure 3. Debridement-induced shift in salivary metabolite abundance in high and low PISA groups.
(a) Volcano plot of relative changes of 69 salivary metabolites in high PISA group. Metabolite abundance shift is plotted on the x-axis as the log2 average fold difference between pre- and post-debridement saliva samples, while −log10 (p values) are plotted on the y-axis. Significantly reduced metabolites via debridement were selected with cutoff values of average fold change >1.3 and p value < 0.05. (b) Volcano plot of relative changes of 69 salivary metabolites in low PISA group. (c) Venn diagram of significantly reduced metabolites in high and low PISA groups. Metabolite numbers are depicted for each category. FC: fold change.

