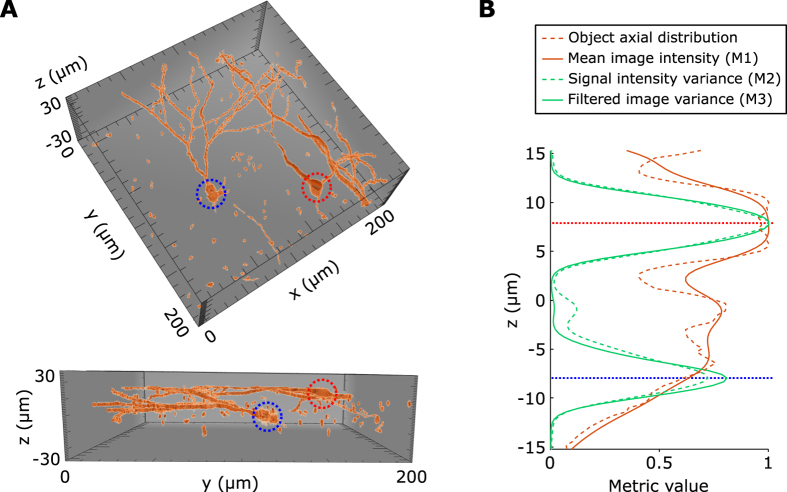
Figure 2. Simulated axial variation of different metrics.
(A) 3D views of the neuron model: two neurons somata (dotted circles) and several dendrites built using fixed hippocampal slices of GFP-expressing neurons. (B) Axial variation of the three considered metrics, the somata positions are indicated by the blue and red dotted line respectively.

