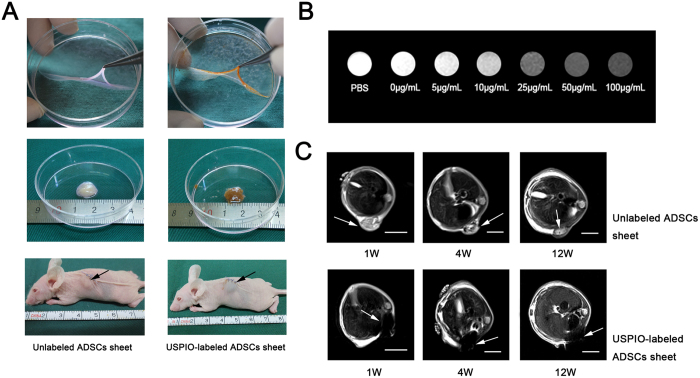
Figure 7. Tracking of USPIO-labeled ADSCs sheet by MRI.
(A): Unlabeled (control) and 50 μg Fe/mL labeled ADSCs sheets were gathered to cell sheet “pellets” with cell scraper, about diameter 1 cm and length 1 cm, and then subcutaneously transplanted in the back of nude mice. (B): T2-weighted MR images of USPIO-labeled ADSCs in vitro. 2 × 10⁵ ADSCs were treated with USPIO at the iron concentrations of 0–100 μg/ml and PBS was taken as control, the signal intensity is proportional to the concentrations of USPIO, the gray difference can be easily identified by naked eye at the iron concentration of greater than or equal to 25 μg/ml. (C): MRIs were examined at 1 week, 4 weeks, and 12 weeks after USPIO-labeled ADSCs sheet transplantation, white arrows represent the area of the USPIO-labeled and unlabeled ADSCs sheet, scale bar: 1 cm.

