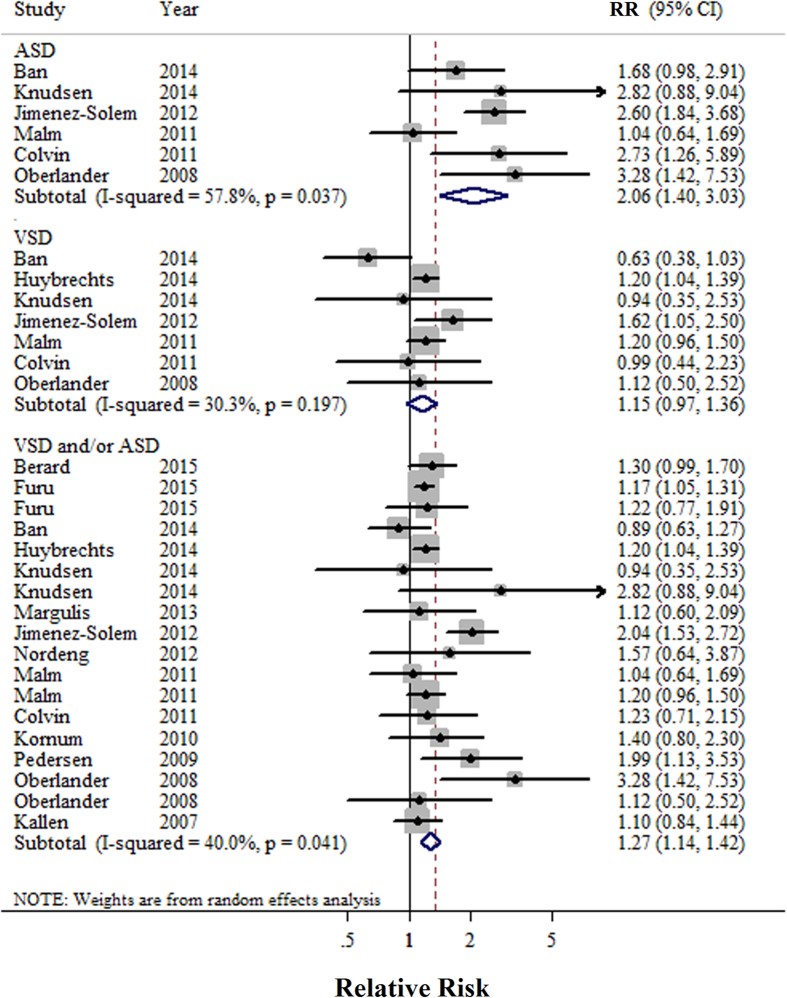
Figure 3. Forest plots of the relationship between SSRIs use and risk of septal defects.
Squares indicate study-specific risk estimates (size of the square reflects the study-specific statistical weight); horizontal lines indicate 95% CIs; diamond indicates the summary relative risk with its 95% CI. ASD: atrial septal defect; RR: relative risk; VSD: ventricular septal defect.

