
Figure 3. Comparison of the ADC distributions in the treatment and the control groups.
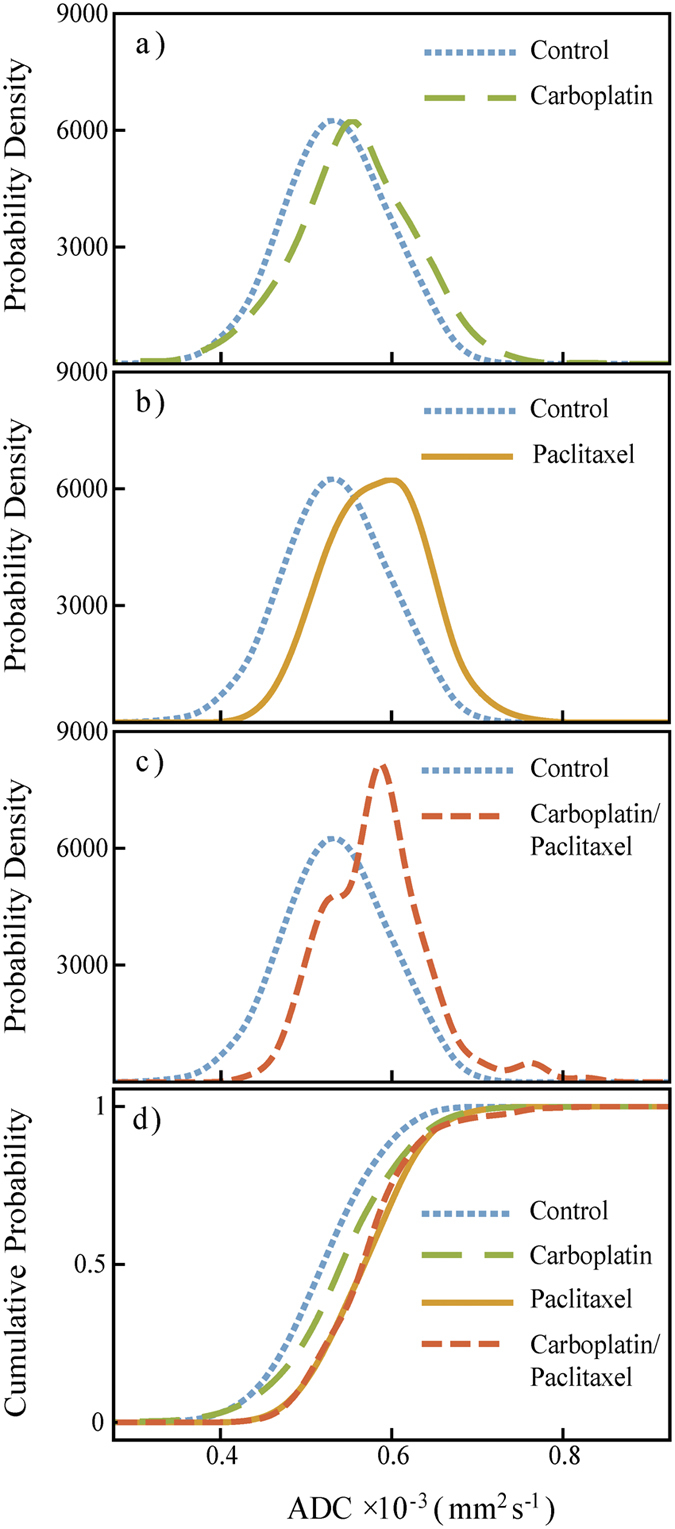
The blue dotted line corresponds to the control (no treatment) group and is displayed together with each of the treatment groups: (a) carboplatin (green line); (b) paclitaxel (orange line); (c) combination carboplatin/paclitaxel (red line). The cumulative probability plots of all four ADC distributions is shown in (d). For clarity, only the splines of the distributions are shown.