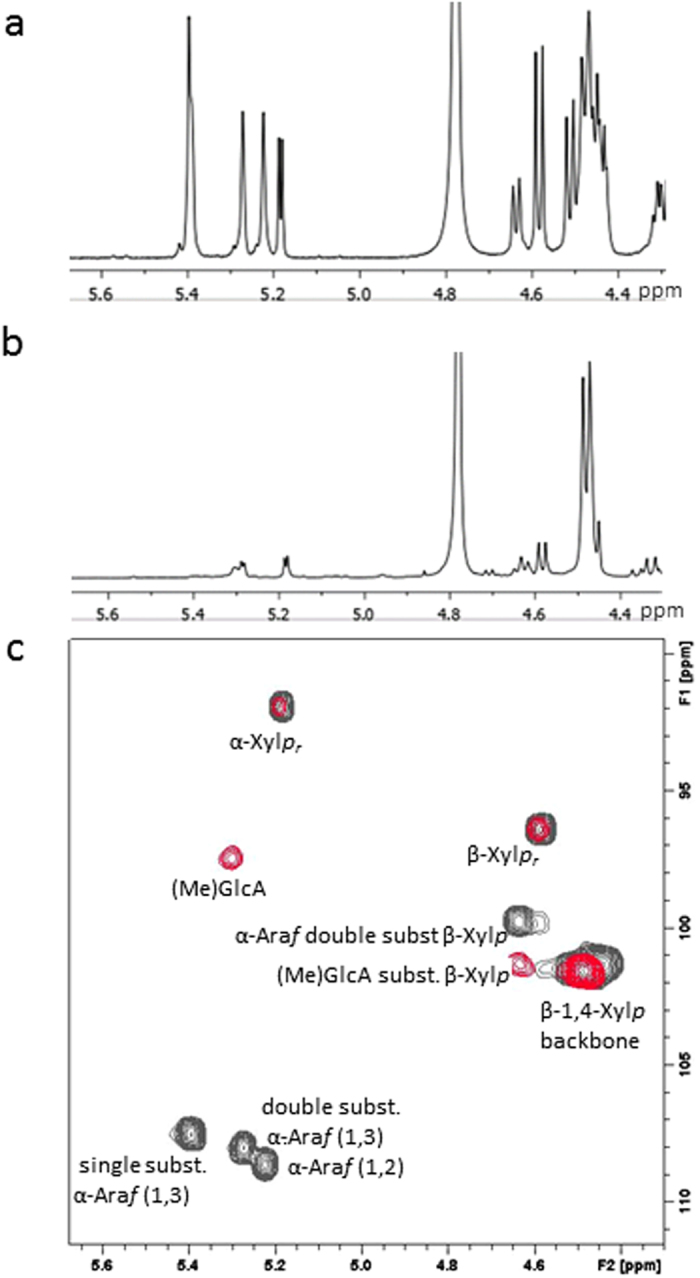
Figure 3. NMR analysis of oligosaccharides.

(a) 1D 1H spectrum of arabinoxylan fraction AX14, (b) 1D 1H spectrum of wheat hemicellulose fraction H8 and (c) HSQC spectrum showing the anomeric reporter resonances of fraction H8 (red), overlaid with that of fraction AX14 (black). The assigned carbohydrate monomers and linkage types are indicated.
