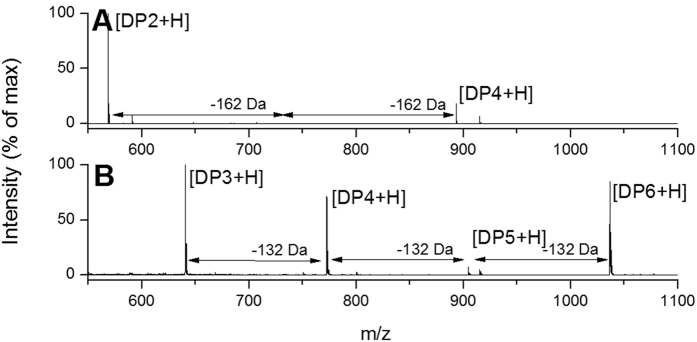
Figure 5. MALDI-ToF MS analysis of A. niger enzyme activity on carbohydrate arrays.
Spectra showing reaction products of incubation of enzymes from A. niger wheat straw culture filtrate on (A) cellotetraose-containing arrays, with DP4 + H 893.1 m/z, DP2 + H 568.8 m/z, (B) xylohexaose-containing arrays, with DP6 + H 1036.5 m/z, DP5 + H 904.6 m/z, DP4 + H 772.5 m/z, DP3 + H 640.5 m/z.

