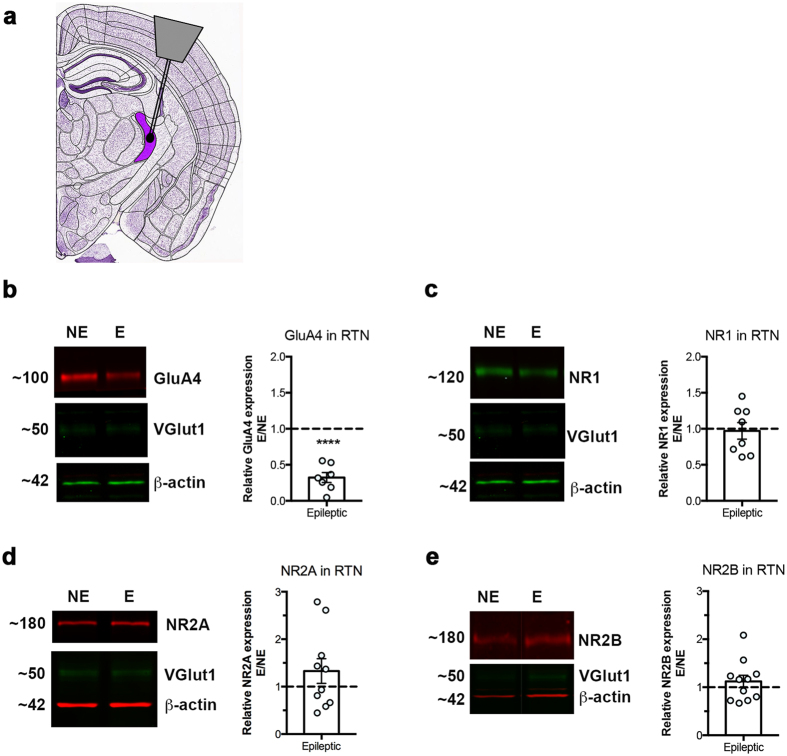
Figure 2. Western blot analysis of AMPA- and NMDA-type excitatory receptor subunits in the RTN.
(a) Schematic diagram indicating the position of RTN on a coronal mouse brain slice. Modified from Allen Brain Atlas. (http://atlas.brain-map.org/#atlas=1&plate=100960236&structure=549&x=5280&y=3744.0000697544647&zoom=-3&resolution=11.97&z=6). Relative expression of AMPAR subunit GluA4 (b), and NMDAR subunits NR1 (c), NR2A (d), NR2B (e) in stargazer RTN; left panel: representative cropped WB images of protein of interest, as well as VGlut1, and β-actin in NE (non-epileptic) and E (epileptic) RTN, right panel: scatter-column combination chart depicting relative epileptic expression of GluA4 (n = 8 NE, n = 7 E; ****p ≤ 0.0001), NR1 (n = 12 NE, n = 8 E; p > 0.05), NR2A (n = 12 NE, n = 10 E; p > 0.05) and NR2B (n = 14 NE, n = 11 E; p > 0.05).

