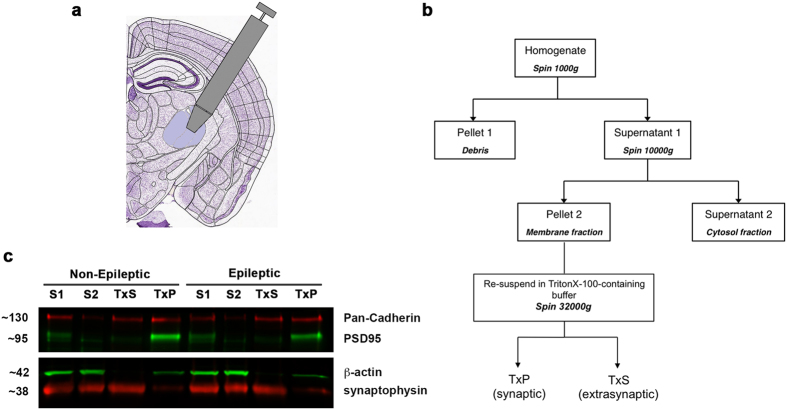
Figure 4. Biochemical fractionation and WB procedure.
(a) Schematic diagram of a coronal mouse brain section indicating the region removed using biopsy punch pen. Modified from Allen Brain Atlas (http://atlas.brain-map.org/#atlas=1&plate=100960236&structure=549&x=5280&y=3744.0000697544647&zoom=3&resolution=11.97&z=5). (b) Flow chart to illustrate fractionation methodology. TxP = Triton X-100 insoluble synaptic fraction (pellet of last spin), TxS = Trinton X-100 soluble extrasynaptic membrane fraction (supernatant of last spin). (c) Representative WB composite images showing bands corresponding to markers, Pan-Cadherin and PSD-95 in different fractions. S1 = supernatant 1 - total lysate; S2 = supernatant 2 - cytosol; TxS = Triton X-100 soluble supernatant – extrasynaptic membrane; TxP = Triton X-100 insoluble pellet – synaptic membrane.

