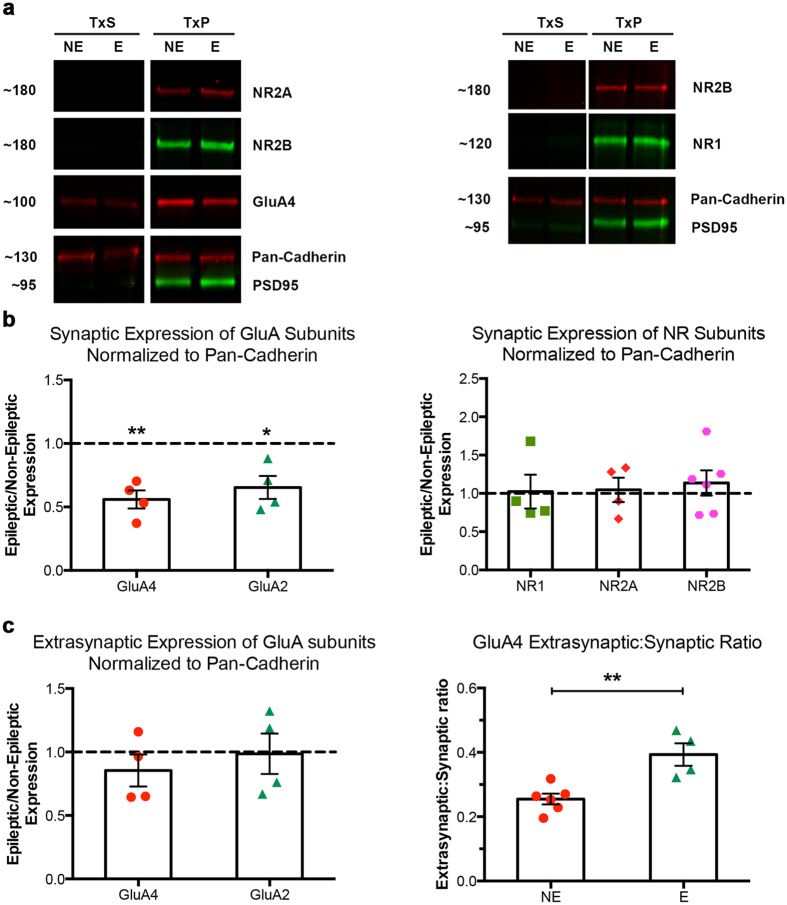
Figure 5. Relative synaptic and extrasynaptic GluA4, NR1, NR2A, and NR2B subunit levels in epileptic stargazer thalamus.
(a) Representative composite images of cropped GluA4, NR1, NR2A, and NR2B immunoblots with markers Pan-Cadherin and PSD-95. (b) Scatter-column combination charts depicting the expression of GluA4 and GluA2, as well as NR1, NR2A, and NR2B subunits in the synaptic membrane fraction of E (epileptic, n = 4 from 4 litters) stargazer thalamus relative to NE (non-epileptic, n = 6 from 4 litters) controls after normalization to Pan-Cadherin (*p ≤ 0.05, ** ≤ 0.01). (c) Scatter-column combination charts depicting the expression of GluA4 and GluA2 subunits in the extrasynaptic membrane fraction of E (epileptic, n = 4 from 4 litters) stargazer thalamus relative to NE (non-epileptic, n = 6 from 4 litters) controls after normalization to Pan-Cadherin (p > 0.05). Scatter-column combination charts depicting extrasynaptic to synaptic GluA subunit ratios in NE controls and E stargazers (** ≤ 0.01, *p ≤ 0.05).

