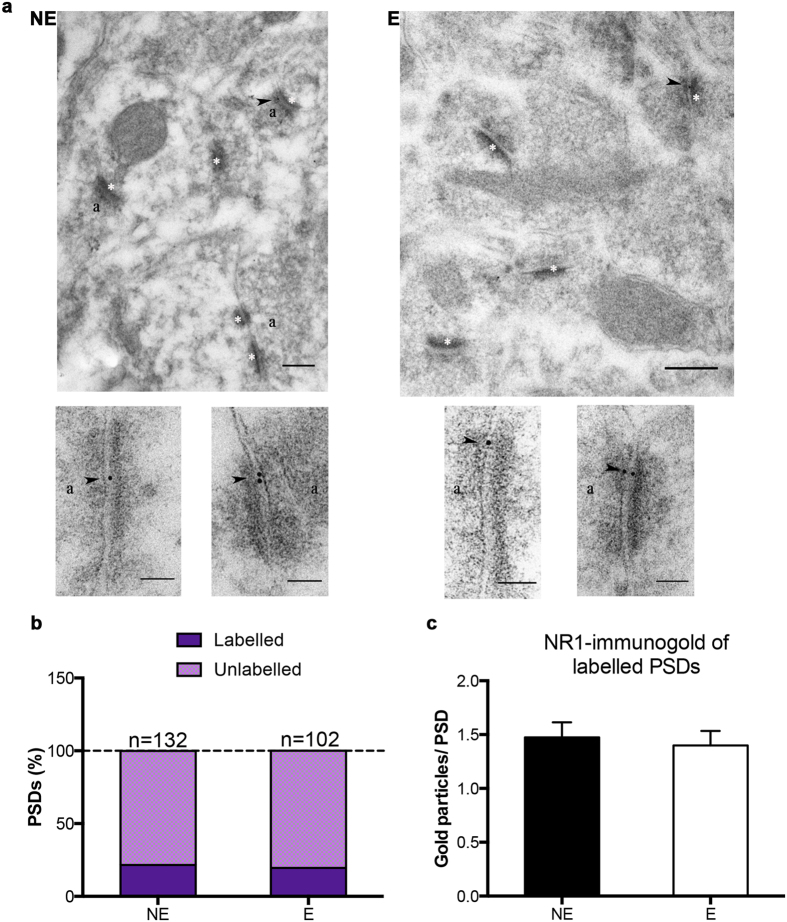
Figure 7. Postembedding immunogold cytochemistry of NMDAR subunit NR1 in the RTN.
(a) Sample electron micrographs from NE (non-epileptic) and E (epileptic) RTN sections illustrating NR1-immunogold (10 nm gold, arrowhead) particles in NE and E sections. White asterisks: PSDs, a: presynaptic terminal. Scale bars: 200 nm for large field size, 100 nm for smaller field size images. (b) Stacked bars depicting the percentage of NR1 labelled and unlabelled PSDs in NE and E RTN sections (n = 132 NE and n = 102 E PSDs). (c) Bar graphs showing the mean (±SEM) NR1-gold particles of labelled PSDs in NE and E RTN (p > 0.05).

