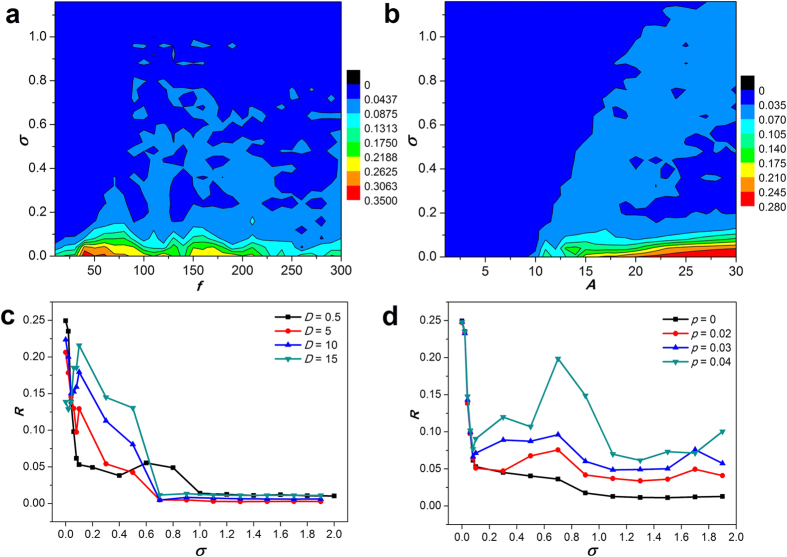
Figure 9. Contour plots and distributions of synchronization factor R.
(a) Contour plot of R in the σ − f plane; (b) contour plot of R in the σ − A plane; (c) R as a function of σ for the different coupling strength D in 2D lattice network; (d) R as a function of σ for the different rewiring probability p in the SW network. The other fixed parameters used here are A = 20 for (a), f = 100 for (b), A = 20 and f = 100 for (c) and (d). We set sufficiently large 500 time units in the calculation of R.

