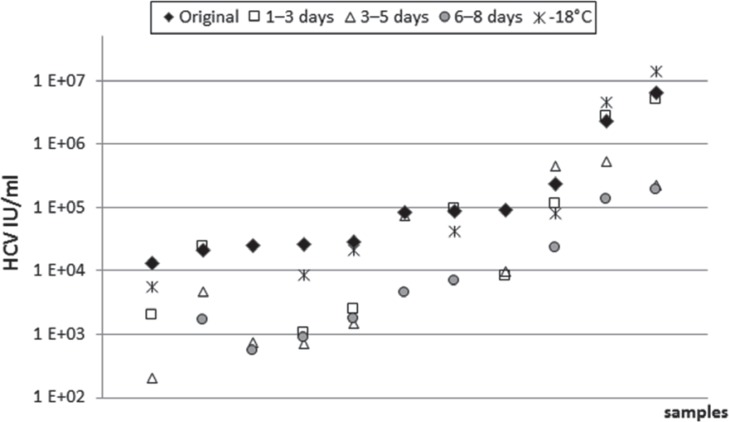
Fig. 1.
HCV viral load (IU/ml) in 11 individual patient samples, which showed viral load differences ≥1 log10 IU/ml after different storage times at 4 ° C or at ≤-18 ° C (points plotted vertically originate from the same sample that was tested at different time points. The abscissa shows the samples blotted according to their viral load in the ‘original sample’ in ascending order).

