
Figure 2.
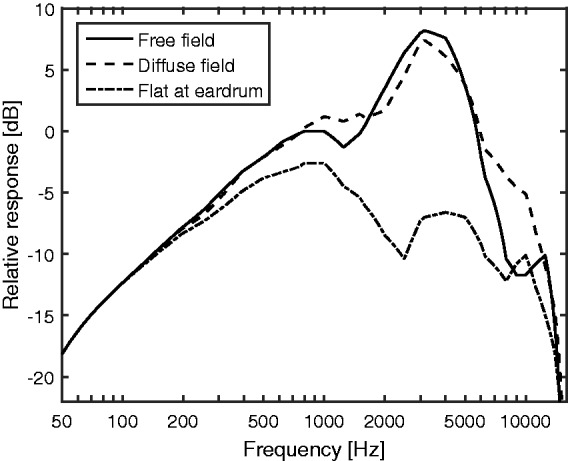
Transfer functions representing the combined effect of the outer and middle ear. The solid curve is for free-field presentation with frontal incidence. The dashed curve is for diffuse field presentation. The dashed-dotted curve shows the transfer function when the waveform is recorded close to each eardrum; in this case, the curve represents the transfer function of the middle ear.