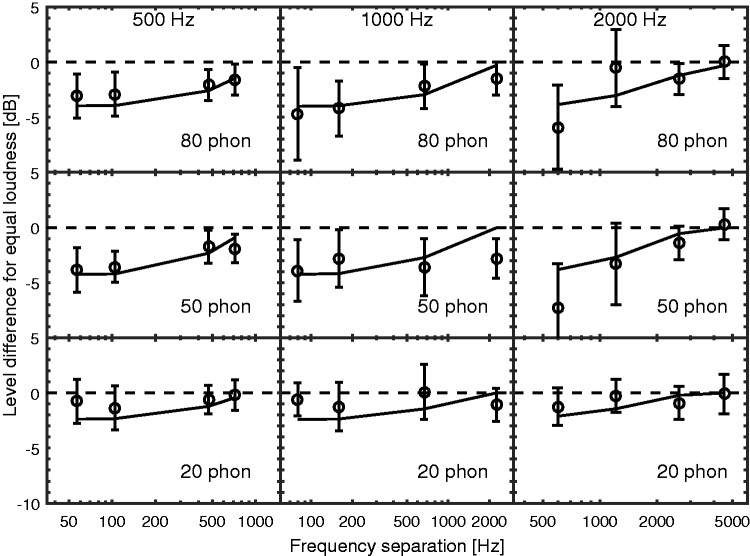
Figure 3.
Comparison of the data of Scharf (1969) (circles) and predictions of the binaural TVL model (black continuous lines). The figure shows values of ΔLmean, representing the level difference required for equal loudness of a tone presented alone to one ear (whose frequency is indicated at the top of each column) and that same tone presented together with a tone of different frequency in the opposite ear. The frequency separation of the two tones is plotted on the abscissa. Each row is for one reference loudness level of the tone presented alone.

