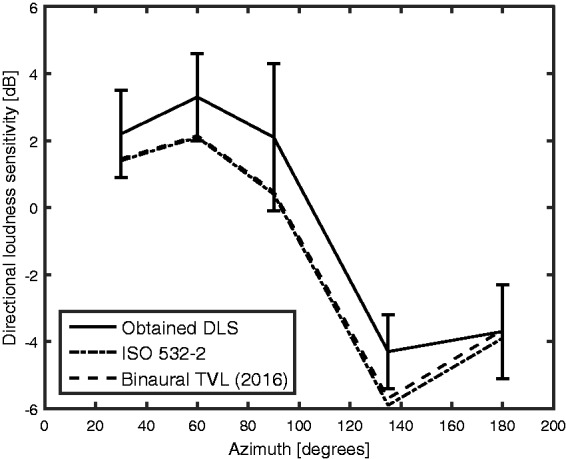
Figure 5.

Comparison of “directional loudness sensitivity” (DLS) values obtained by Sivonen and Ellermeier (2006) (solid lines) with DLS values predicted by the binaural TVL model (long-dashed lines) for the stimuli centered at 5,000 Hz. The DLS values are plotted as a function of the azimuth of the stimulus. For comparison, the dashed-dotted curve shows predictions of the ISO 532-2 model. Error bars indicate 95% confidence intervals of the DLS values.
