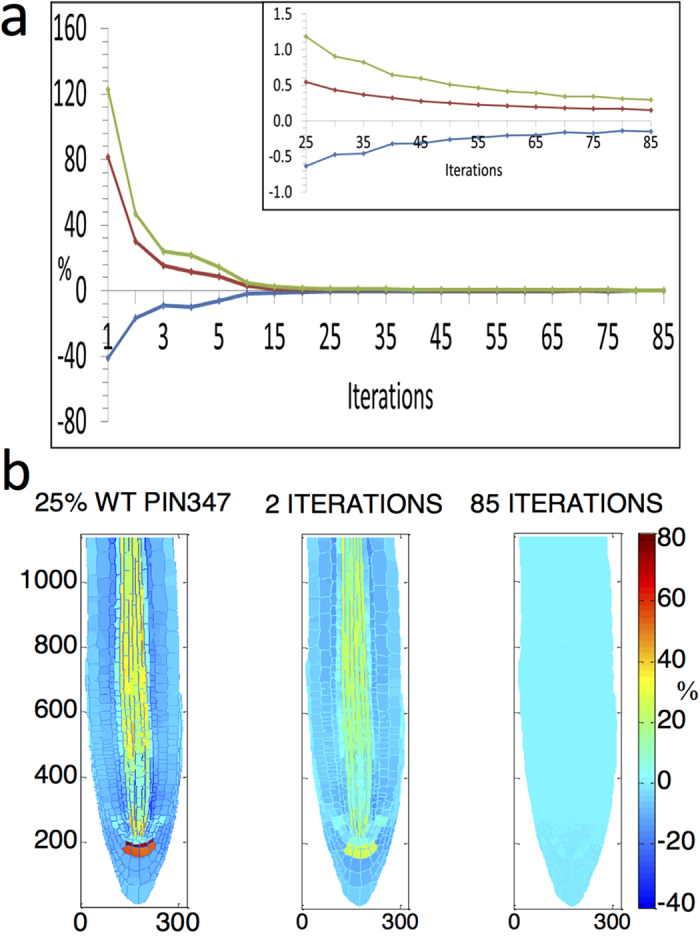
Figure 3. Auxin pattern recovery after 75% decrease in total wildtype PIN3,4,7 concentrations, using the recovery principle over 85 iterations.

(a) Progressive auxin percentage difference from wildtype in the whole root. Blue curve shows the maximum auxin percentage difference below wildtype in the root, at each iteration. Red curve shows the maximum auxin percentage difference above wildtype in the root, at each iteration. Green curve shows the maximum range of the percentage difference from wildtype within the root, calculated by adding the absolute values of the blue and red curves at each iteration. (b) Colour map images of the percentage difference from wildtype auxin concentrations in the root after the initial perturbation of 75% loss of PIN3,4,7, then after 2 recovery iterations, and at full recovery after 85 iterations. Symbol % is the percentage difference relative to corresponding wildtype value.
