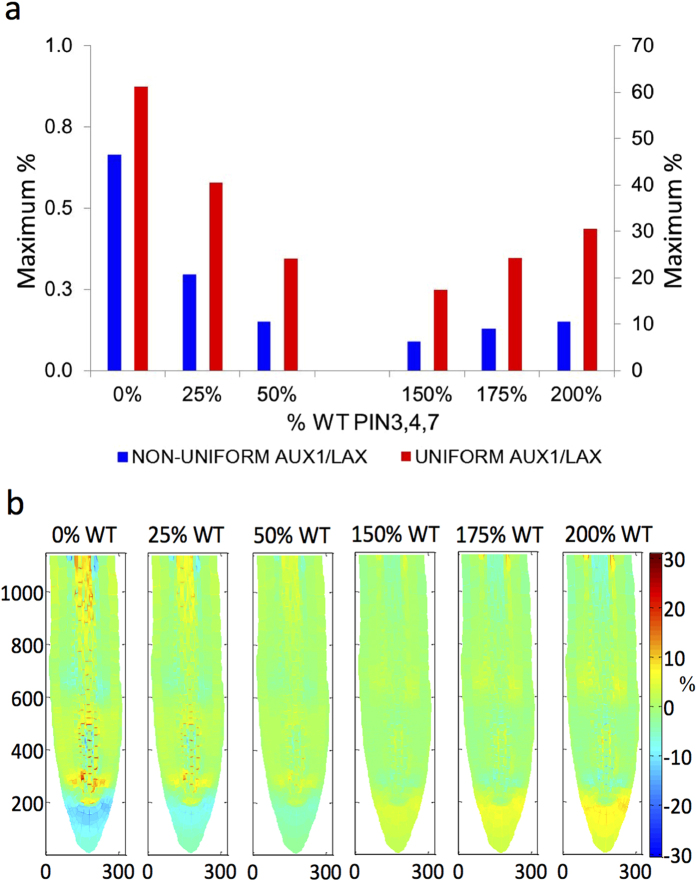
Figure 5. Comparison of auxin pattern recovery by uniform and non-uniform distribution of AUX1/LAX, for 6 different total PIN3, 4 and 7 concentrations set at 0%, 25%, 50%, 150%, 175% and 200% of wildtype.
(a) Maximum percentage difference of auxin concentration from WT after recovery by uniform (red bar, right y-axis) and non-uniform (blue bar, left y-axis) AUX1/LAX distribution, for each case. (b) Colour maps of percentage difference of auxin concentration from WT after recovery by uniform AUX1/LAX distribution, for each case. Symbol % is the percentage difference relative to corresponding wildtype value.

