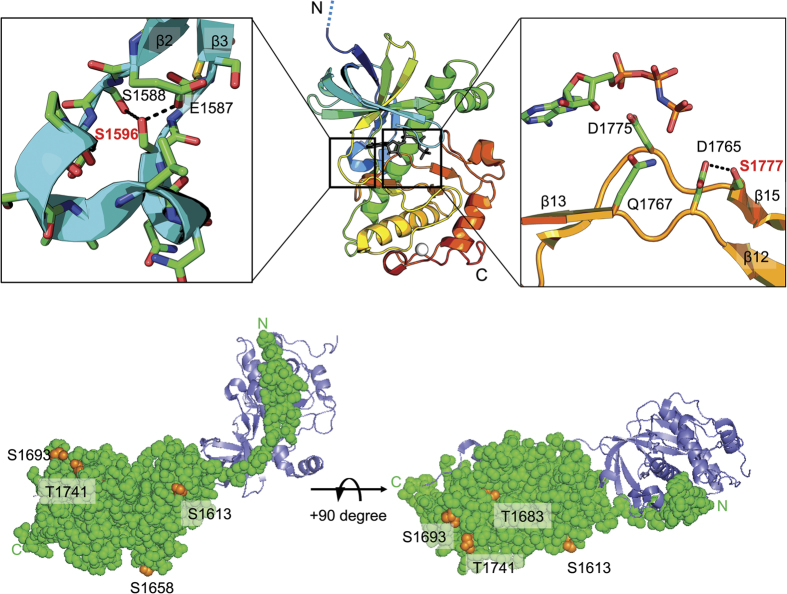
Figure 6. Structural analysis of autophosphorylated residues on TRPM7 kinase domain.
(a) Ribbon diagram in the center shows the structure the core catalytic domain (a.a. 1575–1828) of mouse TRPM7 kinase (PDB code 1IA9). The AMPPNP is rendered as gray sticks and the zinc atom as a white sphere. The N- and C-termini are indicated as “N” and “C”. The expanded view on the left highlights the location of residue S1596 on an omega-loop between the β2 and β3 strands. Side chains of residues are shown as sticks. Interactions between residues S1596, S1588 and E1587 are indicated with dashed lines. The expanded view on the right shows the position of residue S1777 at the active site along with catalytic residues D1765, Q1767, and D1775. The nucleotide and side-chains of key residues are shown as sticks. The interaction between S1777 and D1765 is shown with a dashed line. (b) Diagram depicts dimerized TRPM7 kinase. Space-filling model shows the location of residue S1613, S1658, T1683, S1693, and T1741 (orange) on the surface of kinase monomer A (green). The N- and C-termini of the monomer are indicated as “N” and “C”. A dimerizing monomer B is shown as the ribbon in purple.

