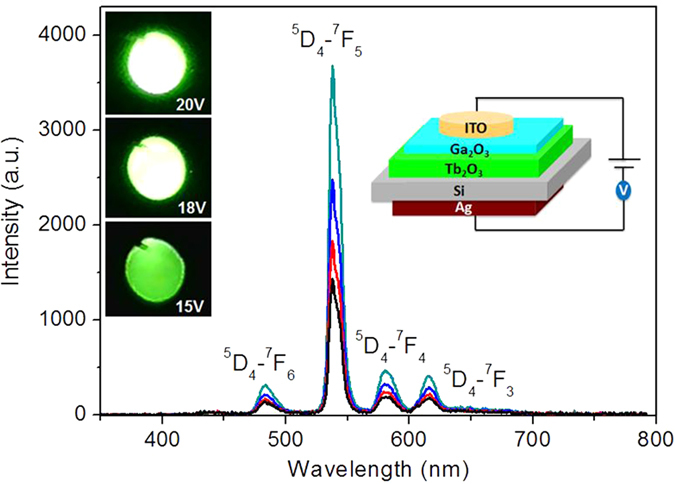
Figure 2. EL performance of the Tb2O3 LED.

EL spectra of the LED at the voltage of 12–20 V, the insets show the structure diagram of the LED and EL photos of the device at different voltages.

EL spectra of the LED at the voltage of 12–20 V, the insets show the structure diagram of the LED and EL photos of the device at different voltages.