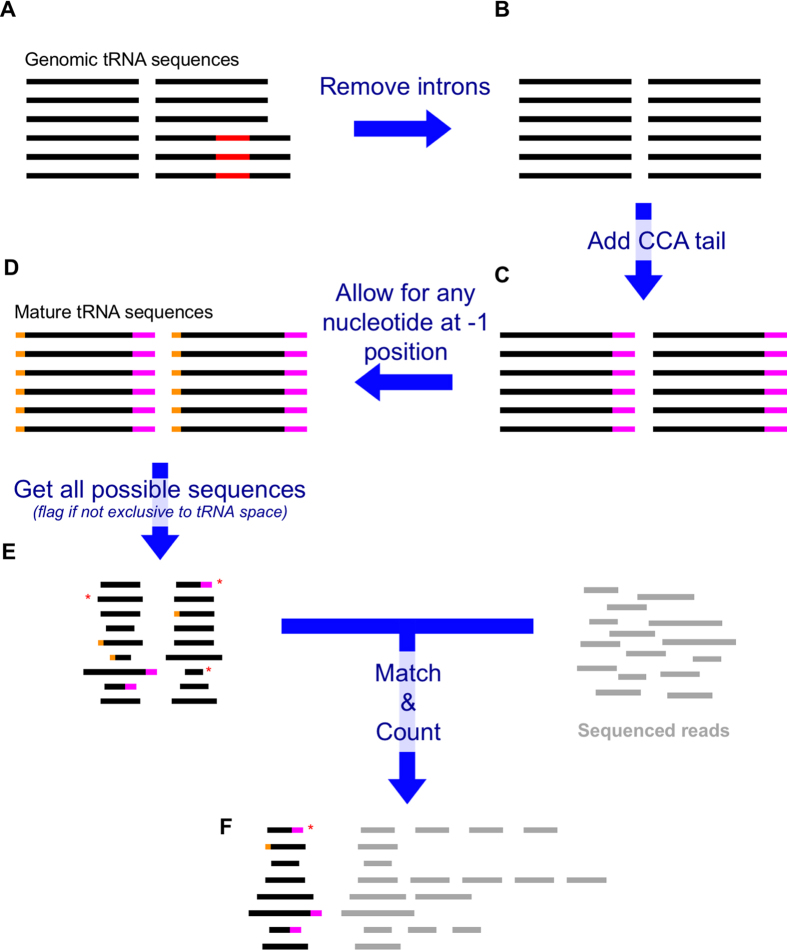
Figure 6. Flowchart of MINTmap.
Genomic sequences of the tRNA reference set (A) are processed to simulate exon splicing (B), and then get modified to admit the non-templated CCA addition (C) and the “−1” nucleotide of tRNAHis (D). The resulting sequences are fragmented computationally into (overlapping) segments of variable lengths and entered into a lookup table: sequences that are not exclusive to tRNA space are flagged at this point using metadata added to the table. The lookup table is then used to process a (quality-filtered and adapter-trimmed) short RNA-seq dataset (E) to generate a tRF expression profile table (F). Red: introns. Magenta: CCA tail. Orange: nucleotide at -1 position. Asterisk: tRF not exclusive to tRNA space (possible false positive tRF).

