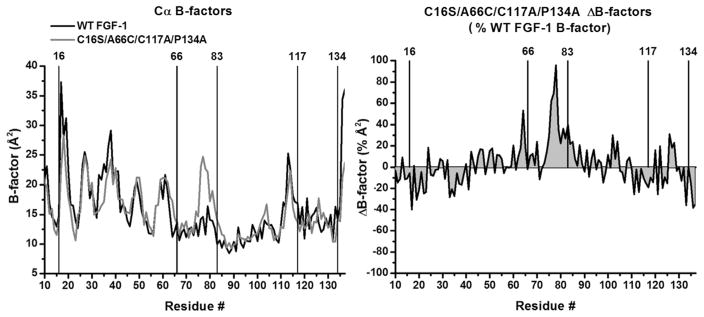
Figure 2.
X-ray structure B-factor comparison of WT FGF-1 and C16S/A66C/C117A/P134A mutant. Left panel: an overlay of Cα B-factors for WT FGF-1 (1JQZ, molecule A; black line) and C16S/A66C/C117A/P134A (molecule A; gray line). The location of the mutation sites (as well as the oxidized half-cystine at Cys83) is indicated. Right panel: a ΔB-factor plot scaled by the WT FGF-1 B-factor ((mutant–WT FGF-1)/WT FGF-1). The 2 graphs demonstrate broad conservation of Cα B-factors in response to mutation, with the exception of a demonstrable increase in B-factors for the region 75–80 in the C16S/A66C/C117A/P134A mutant.

