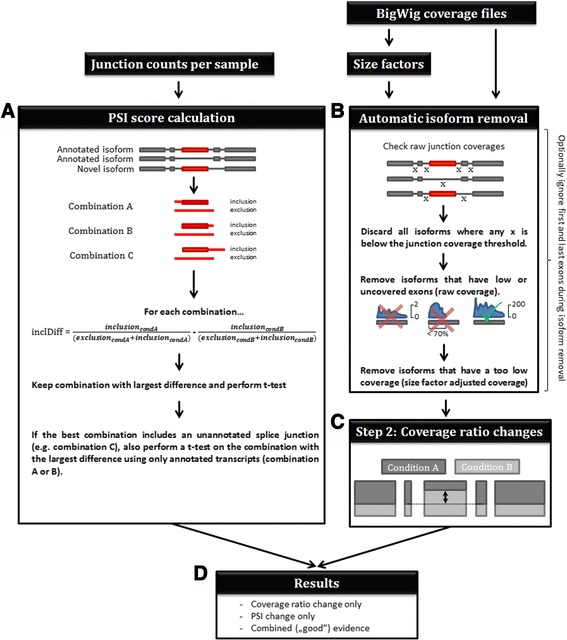
Fig. 1.

Workflow of the Manananggal method. Junction counts are merged to generate one large table with all possible junctions. The table is indexed for random access and used to identify splice junction pairs that differ between conditions (a). One junction in each pair corresponds to a junction arguing for the inclusion and another for the exclusion of the exon. All possible inclusion/exclusion junction combinations for an exon are used to identify the combination that shows the largest difference between conditions. This combination is subsequently used in a t-test to provide a p-value for sorting of the results. If the best junction pair includes read counts of an unannotated junction we also report the best available result using only known junctions. The right side of the image illustrates the detection of coverage ratio changes. BigWig files are used to calculate size factors for each sample that are used to adjust for sequencing depth differences. b An automated isoform selection discards isoforms that contain exons with insufficient coverage from the analysis. c The arrow indicates an alternatively spliced exon that shows a large change in the coverage ratio (depicted by dark grey and light grey color for each condition) compared to the remaining exons (or exon groups). Changes in the coverage ratios between different conditions are identified by testing the coverage ratios of each nucleotide of the query exon against the mean coverage ratios of the remaining exons/exon groups. d Finally, a result list is generated that contains ASE candidates that are supported by PSI scores only, ratio changes only, or both
