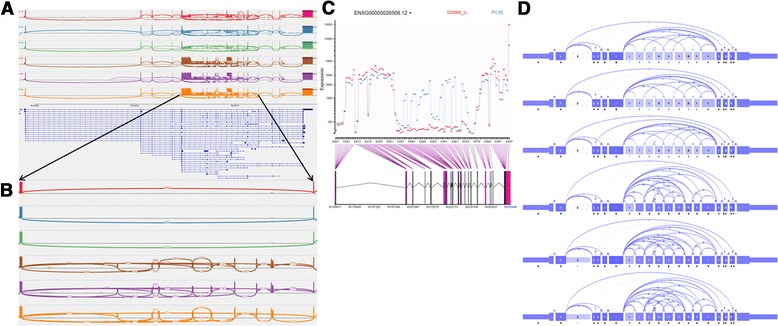
Fig. 10.

Visual representation of CD44 in the IGV Viewer, DEXSeq and SpliceSeq. a shows a sashimi plot of the CD44 gene with all junctions visible. A difference between the first three (GS689_Li) and last three samples (PC3E) is visible, but it is very challenging to identify which junctions belong to the ASEs or what ASEs are actually present in the data set. b shows a sashimi plot that was zoomed to the region of interest. Junctions with a coverage below 100 were hidden from the picture to get a cleaner view of the region. It becomes clear that the GS689_Li samples mostly skip all optional exons in this region, while CD44 expresses multiple of them. However, it remains difficult to tell which isoforms are expressed in CD44. c shows the DEXSeq plot for CD44. A large number of exonic parts appear to be differentially expressed. d shows the sashimi plots for all 6 samples in SpliceSeq. A coverage difference is visible for all optional exons that are lower expressed in the GS689_Li samples. The PC3E samples show a large number of junctions
