Fig. 2.

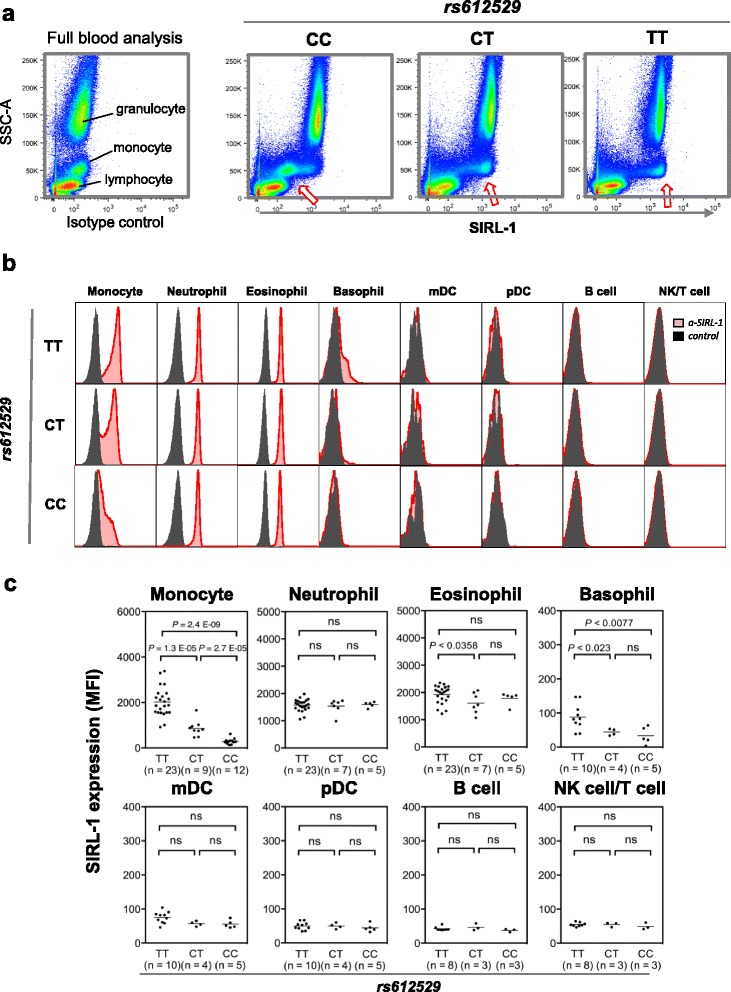
Cell-type–specific effect of rs612529 on SIRL-1 surface expression. a Flow cytometry analysis of whole blood samples. Whole blood samples were stained with a SIRL-1 specific antibody (right panel) and an isotype-matched control antibody (left panel). The staining is shown vs. the side scatter (SSC-A), which allows a simple discrimination of granulocytes, monocytes, and lymphocytes. The plots are representative examples of individuals with the rs612529 genotype TT, TC, and CC. Arrows indicate the gradual increase in SIRL-1 staining on monocytes. b Genotype-dependent SIRL-1 expression on various cell types. SIRL-1 staining (red) in reference to the isotype control (black) is shown for each of the three rs612529-genotypes for myeloid cells (monocyte, neutrophil, eosinophil, basophil, mDC, and pDC) and two lymphocyte subsets (B cell, NK cell/T cell). Data were generated by flow cytometry from whole blood samples after gating on the respective cell subset (gating strategy is displayed in Additional file 4). c Cohort-wide distribution of the SIRL-1 expression. The dot plots summarize the SIRL-1 FACS data for a cohort of 44 genotype-matched individuals
