
Fig. 2.
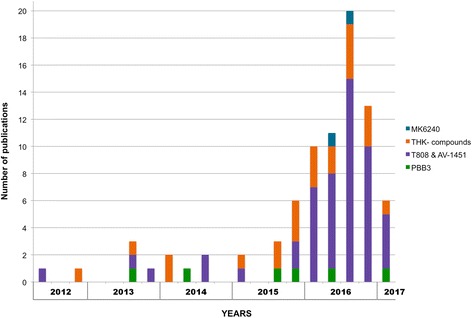
Number of publications on tau PET tracers in the recent years. The graph starts from the first publication on a tau tracer; each bar plot represents a period of three months
Official websites use .gov
A
.gov website belongs to an official
government organization in the United States.
Secure .gov websites use HTTPS
A lock (
) or https:// means you've safely
connected to the .gov website. Share sensitive
information only on official, secure websites.
Number of publications on tau PET tracers in the recent years. The graph starts from the first publication on a tau tracer; each bar plot represents a period of three months