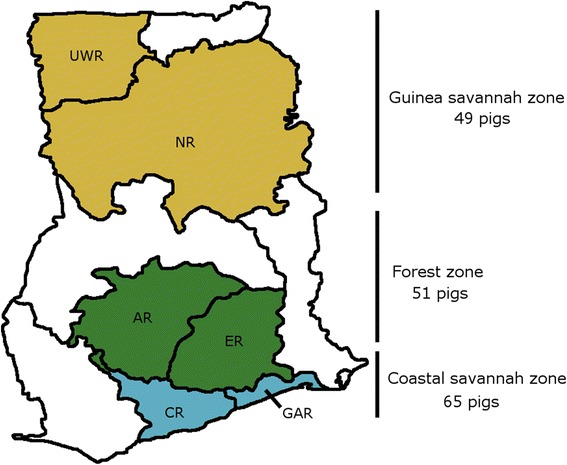
Fig. 1.

Map of Ghana The map shows the agro-ecological zones of Ghana and composite regions where pigs were sampled. The numbers of pigs per area are given on the right. (UWR = Upper West Region; NR = Northern Region; AR = Ashanti Region; ER = Eastern Region; CR = Central Region; GAR = Greater Accra Region)
