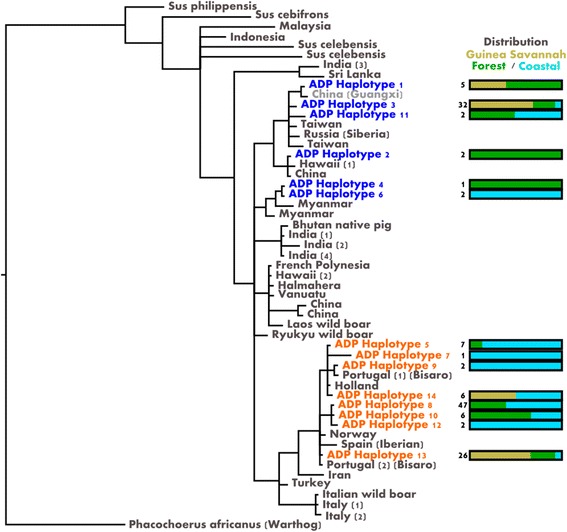
Fig. 2.

A Bayesian phylogenetic tree based on analysis of the mitochondrial D-loop region. The panel shows the local haplotypes (in blue) clustering with sequences of Asian origin, and those (in orange) clustering with the sequences of European origin. To the right of each haplotype, the number beside the bar gives the total for individuals that share the haplotype, and the bar shows the regional distribution. The African warthog was used as an outgroup
