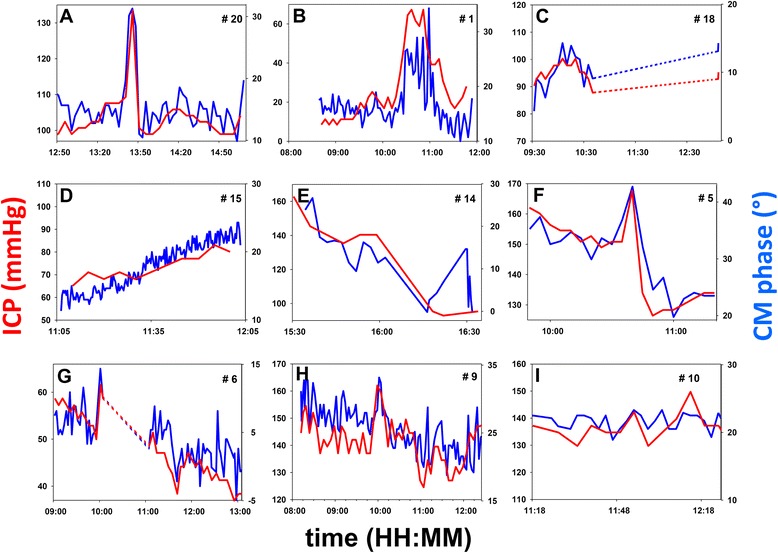
Fig. 2.

Examples of individual time courses of ICP (red, mmHg) and CM phase (blue, degrees). Vertical range: 20 mmHg for ICP in all diagrams; adjusted according to the CM-phase-to-ICP slope, for CM phase (also see Fig. 3a). In every panel labeled from a-i, patient numbers (#n, upper right corners) match those in Fig. 1c, left column. Dashed lines: intervals of time during which data collection was interrupted by a nursing procedure
