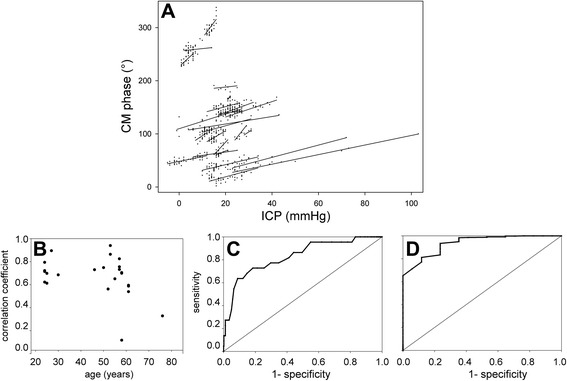
Fig. 3.

Statistical analysis of cochlear microphonic potential (CM) monitoring outcomes. a linear fits of individual CM-phase to intracranial pressure (ICP) relationships. b Pearson R coefficients against age. c-d Receiver operating characteristic plots of true positive vs fallout of binary classifications based upon a 5-mmHg increase in ICP (c) and a 5-mmHg decrease in ICP (d)
