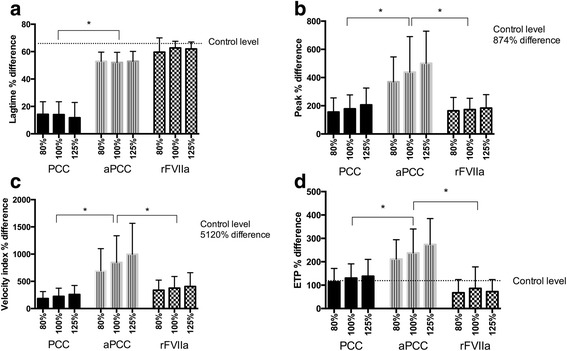
Fig. 3.

Difference in thrombin generation parameters after adding reversal agents in different doses. Differences in thrombin generation parameters are expressed as per cent difference from baseline (rivaroxaban with no haemostatic agent added). The doses of the haemostatic agents are 80%, 100% and 125% of the suggested doses, as described under study design. a. Lag time obtained by Calibrated Automated Thrombogram (CAT) on platelet-poor plasma (minutes); b. Peak height of thrombin obtained by CAT on platelet-poor plasma (nM); c. Velocity index obtained by CAT on platelet-poor plasma (nM/min); d. Endogenous Thrombin Potential (ETP) obtained by CAT on platelet-poor plasma (nM*min). Control level, the difference between the mean control value and the patient baseline values, is illustrated by the dotted line. *p < 0.005. PCC: prothrombin complex concentrate, aPCC: activated PCC, rFVIIa: recombinant factor VIIa
