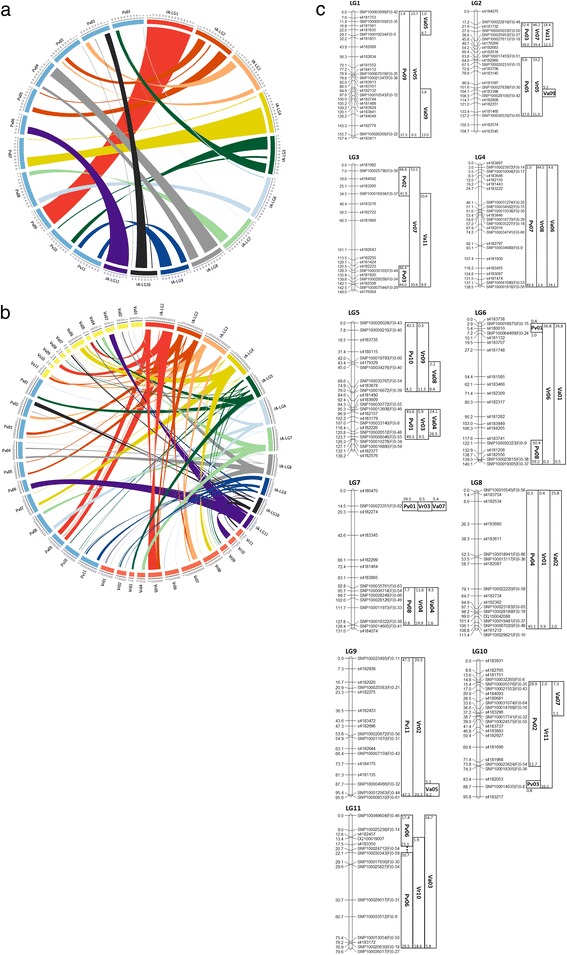
Fig. 4.

a This figure illustrates the conserved syntenic blocks corresponding to linkage groups of genetic Map IA in bambara groundnut compared with the common bean genome (scaling: 1 cM to 0.5 Mbp). b The homologous relationship of the bambara groundnut Map IA with common bean (Pv, blue), adzuki bean (Va, yellow) and mung bean (Vr, orange) genomes. The syntenic locations of the unassigned superscaffolds of aduki bean and mung bean genome have been omitted for simplicity (scaling: 1 cM to 0.5 Mbp). c A simplified summary of the pseudo-physical map of bambara groundnut using the syntenic locus information from common bean (Pv), adzuki bean (Va) and mung bean (Vr) across the linkage groups of bambara groundnut genetic Map IA (based on chromosome number). The mapped locations to the superscaffolds in both adzuki bean and mung bean genomes were omitted. Chromosomal location positions are in Mbp
