Fig. 4.

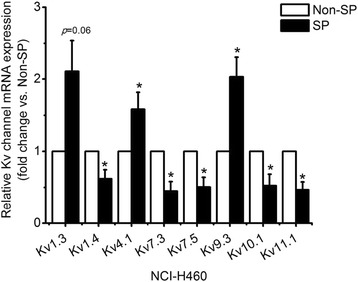
Comparison of Kv channel expression between sorted SP cells and Non-SP cells. Real-time RT-PCR analysis of Kv channel subtypes. Results are mean ± SE of triplicate experiments, (*) p < 0.05

Comparison of Kv channel expression between sorted SP cells and Non-SP cells. Real-time RT-PCR analysis of Kv channel subtypes. Results are mean ± SE of triplicate experiments, (*) p < 0.05