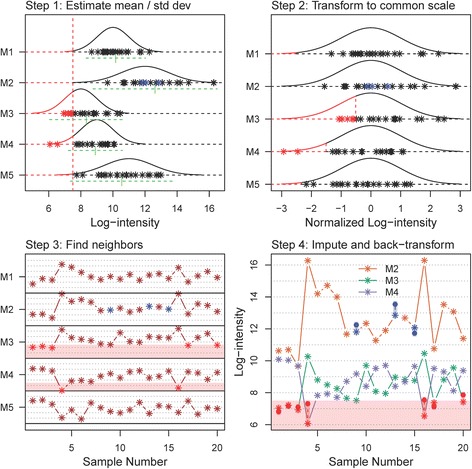
Fig. 2.

Steps in the KNN-TN imputation algorithm. Step 1 (top left panel): The first step in the KNN-TN procedure is to estimate the mean and standard deviation of each metabolite. Here, the distribution and simulated values for five metabolites (M1-M5) and 20 samples are given. For each metabolite, observed values are given by black stars. Additionally, M2 has three values that are MAR (blue stars), while M3 has five points that are MNAR (below the LOD, red stars) and M4 has two points below the LOD (red stars). The estimate mean for each metabolite is indicated by the underlying green vertical dash, while the green horizontal dashed line represents the estimated standard deviation (the line extends out +/− two standard deviations). Step 2 (top right panel): The second step in the procedure is to transform all the values to a common scale, with mean zero and standard deviation of one for each metabolite. The original points are represented in this transformed scale with black stars, with MNAR values in red and MAR values in blue. Step 3 (bottom left panel): The next step is to find metabolites with a similar profile on this common scale. In this case, metabolites M1-M3 are highly correlated and M4-M5 are also highly correlated. The two groups of metabolites are also negatively correlated with each other, and this information can also be used to aid the imputation process. The missing values are imputed in the transformed space, with weights based on the inverse of the distances 1 − |r| (r is the Pearson correlation between the two metabolites). Contributions from negatively correlated metabolites are multiplied by negative one. The region below the LOD is shaded light red. Step 4 (bottom right panel): The values are then back-transformed to the original space based on the estimated means and standard deviations from Step 1. Here, we show the three metabolites with missing values M2, M3, and M4. Solid circles represent imputed values for MAR (blue circles) and MNAR (red circles). The region below the LOD is again shaded in light red, while the slightly darker shaded regions connect the imputed value with its underlying true value. The imputed values are fairly close to the true values for metabolites M2 and M3, while for metabolite M4 the values are further away due to under-estimation of the true variance for M4 (c.f. top left panel)
