
Fig. 1.
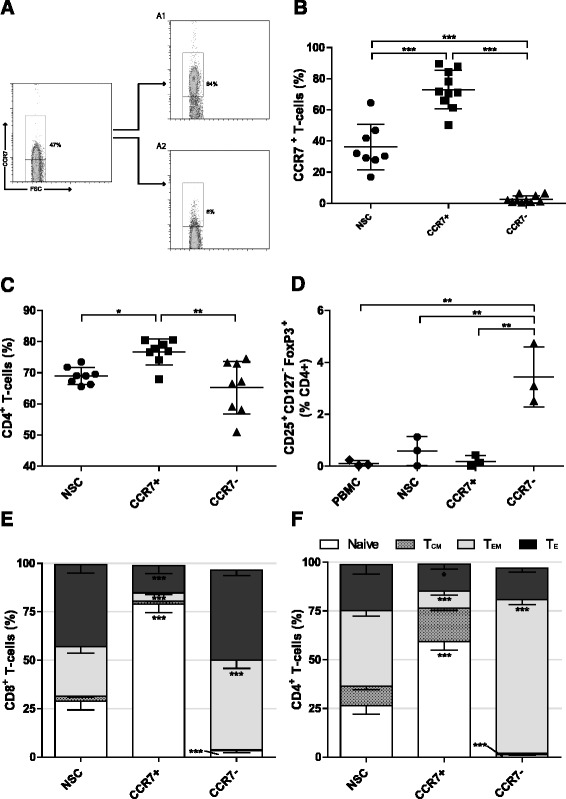
Early differentiated T cell selection using CCR7. a Representative plot following Isolation of early differentiated T cells using immuno-magnetic beads against CCR7. A1 CCR7+ and A2 CCR7− fractions. The frequency of b CCR7+, c CD4+ and d CD25+ CD127− FoxP3+ Tregs in each fraction following CCR7 selection as determined by flow cytometry. NSC Non sorted control T cells. Error bars ± SD, statistical tests one way ANOVAs with Bonferroni’s post-test. e and f The phenotype of CD8+ and CD4+ T cell populations respectively following CCR7 selection; Naïve (CCR7+ CD45RA+), Central memory (CCR7+ CD45RA−), Effector memory (CCR7− CD45RA−), Effector (CCR7− CD45RA+). Error bars show ± SEM. For each phenotype; significant difference from NSC T cells is shown. * P < 0.05, **P < 0.01, *** P < 0.001