
Fig. 5.
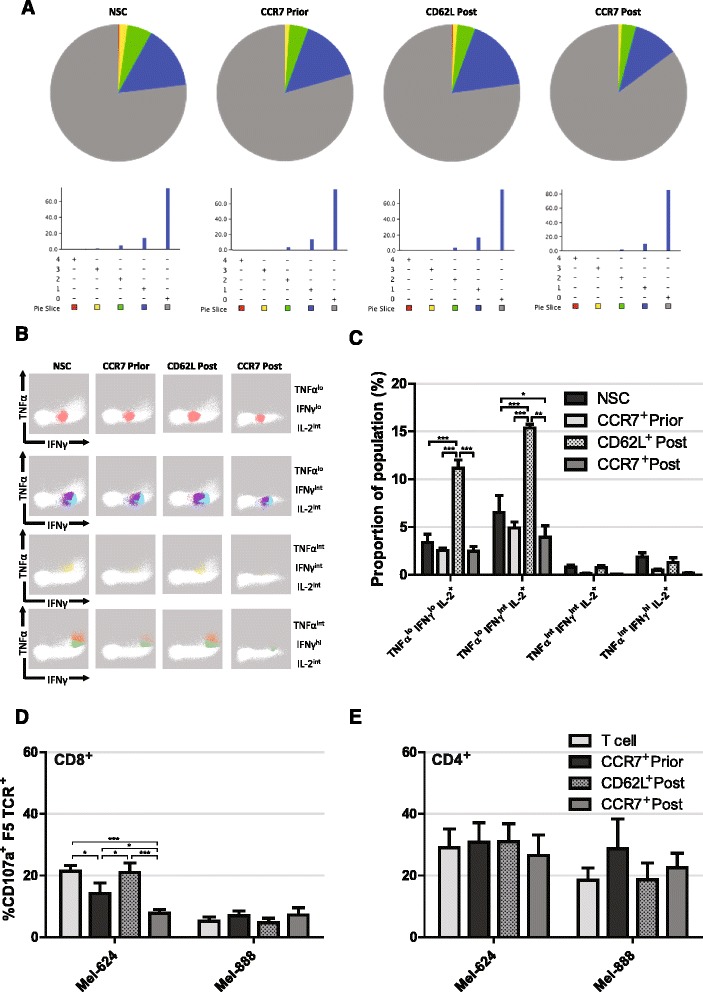
Functionality of selected T cells. a Representative pie charts of T cell proportions secreting 0 – grey, 1 – blue, 2 – green, 3 – yellow or 4 – red cytokines of a panel consisting of IFNγ, IL-2, IL-10, IL-17A and TNFα upon 16 h incubation with Mel-624 cells. b Visual representation and c quantification of IL-2 secreting cell subsets following CCR7 selection prior to, or CD62L or CCR7 selection post expansion ex vivo and incubation with target Mel-624 cells. Manual gating was utilised to identify CD8+ T cells and data from 4 biological repeats were pooled before FLOCK analysis. d CD8+ and e CD4+ T cell CD107a expression following selection prior to, or post expansion and incubation with target Mel-624 cells. Error bars show ± SEM