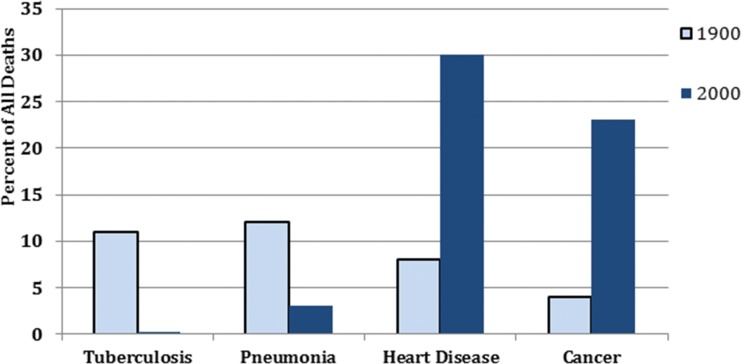
Figure 9.
Comparison of causes of death in the USA, 1900 versus 2000. The percentage of all deaths due to four classes of diseases are shown for the years 1900 (light blue bars) and 2000 (dark blue bars). The dark blue bar for tuberculosis in 2000 in actuality should have been invisible. However, for this figure, we falsely increased the height of the bar to make it just visible (59).

