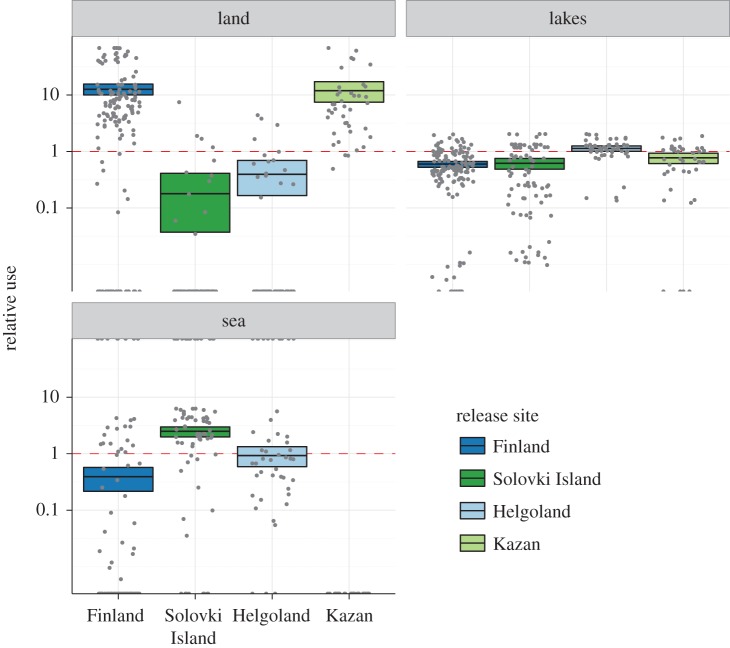
Figure 3.
General habitat use of lesser black-backed gulls. Shown here are the relative preferences of all treatment groups for terrestrial, marine and freshwater habitats. Unbiased use of these habitat types is represented by the dashed red line. Values above the red line correspond to a positive preference (a relative use of 10 indicates that the bird was observed in a certain habitat 10 times more often than expected from the availability of this habitat type), smaller values correspond to a negative preference. Coloured boxes present the 95% CIs on the mean per treatment group (acquired through 1000-fold bootstrapping), the black bar represents the observed mean, and grey dots represent the raw data.

