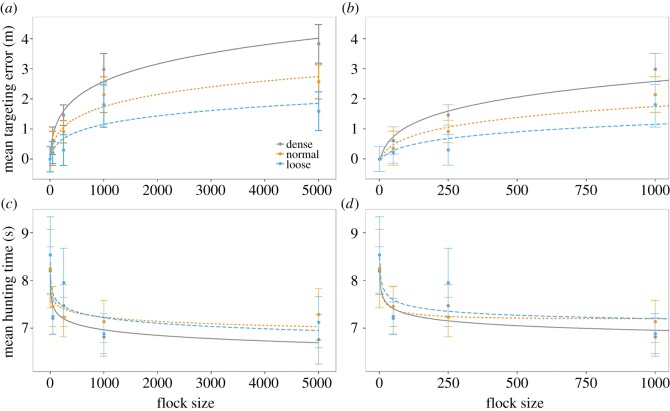
Figure 1.
(a,b) Graphs of participant mean targeting error plotted against the natural logarithm of flock size. (c,d) Graphs of participant mean hunting time plotted against the natural logarithm of flock size. The leftmost images display the whole dataset; the rightmost are zoomed into flock sizes 1–1000. Line colour and solidity indicate flock density, and error bars indicate within-subject 95% confidence intervals, fitted lines are quadratic polynomials.

