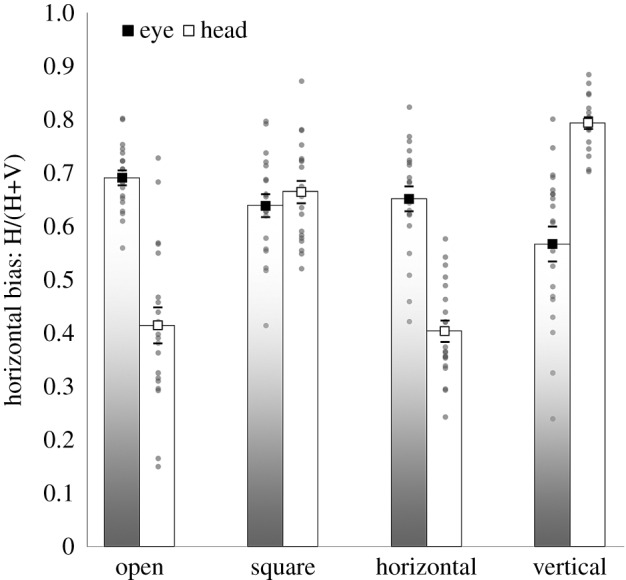
Figure 3.

Horizontal bias scores for eye and head movements for gaze-contingent viewing with open (no window), square, horizontal and vertical windows. Grey circles show individual data points and square markers indicate mean values. Error bars depict one standard error of the mean.
