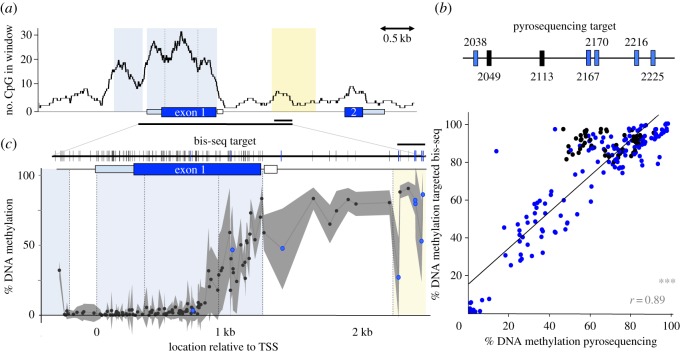
Figure 2.
CpG distribution and DNA methylation across the avpr1a locus. (a) A sliding window (window = 300 bp, step = 1 bp) of CpG count along 8 kb of the avpr1a locus. Two predicted CpG islands are shaded light blue and the putative intron enhancer is yellow. The region covered by pyrosequencing (0.2 kb) and bis-seq (3 kb) marked by horizontal black bar. (b) Pyrosequencing assay included two fixed CpGs (black) and five polyCpGs (blue) within the putative enhancer. Pyrosequencing methylation measures correlate with bis-seq results (r = 0.89, p < 0.001). (c) Top, 113 fixed sites included in bis-seq target are represented by black vertical bars and eight polymorphic CpGs (polyCpGs) are marked blue. Bottom, average %DNA methylation from bis-seq at fixed (black) and polymorphic (blue) CpGs across 3 kb of avpr1a locus. Standard deviation depicted in grey shading. Gene feature borders are separated by dashed lines. ***p ≤ 0.001.

