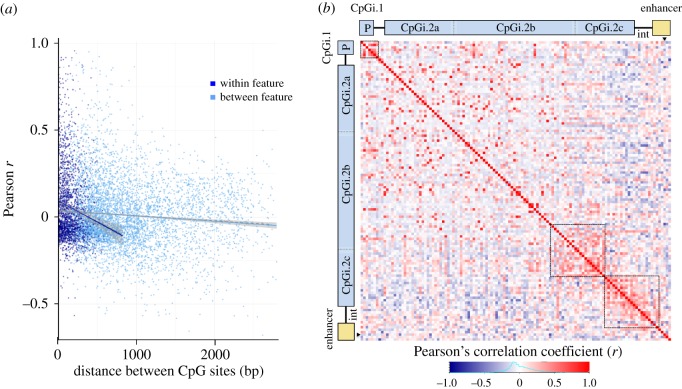
Figure 3.
Patterns of CpG co-methylation across avpr1a. (a) Co-methylation measures (Pearson's correlation coefficient, r) are plotted against distance of CpG pairs within (dark blue, r = −0.14, p < 0.0001) and between gene features (light blue, r = −0.09, p < 0.0001). (b) Co-methylation between 122 fixed and polymorphic CpG sites depicted in a heatmap. Corresponding gene features are schematized on top and left, position of polyCpG 2170 is marked by black triangles and abbreviations are as follows: P = promoter, int = intron). Three clusters of positive co-methylation are outlined by dashed lines.

