Figure 6.
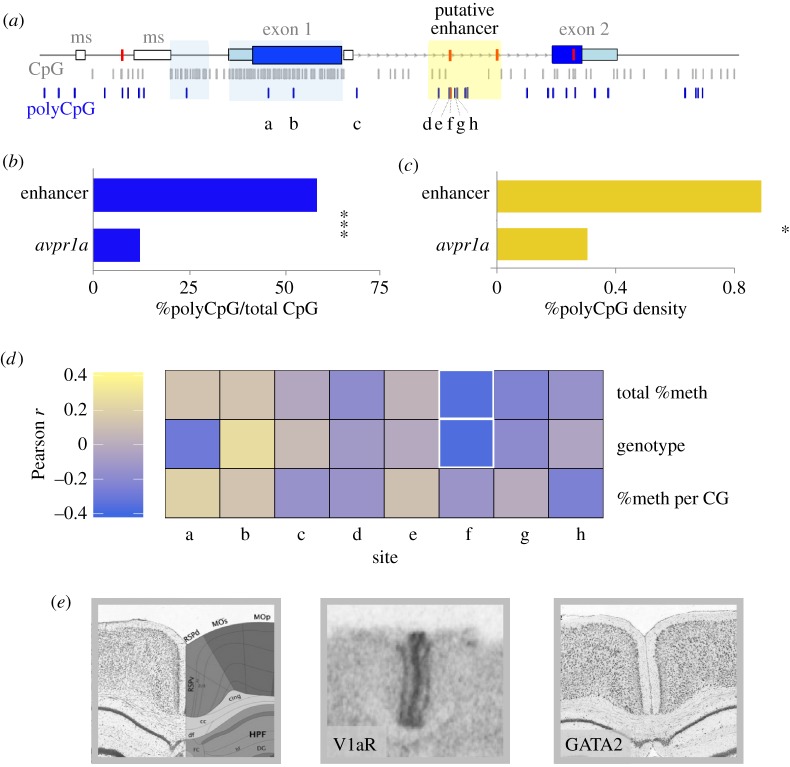
Distribution of polyCpGs and their sequence-specific associations with RSC-V1aR. (a) Distribution of fixed (grey) and polymorphic CpGs (blue) along avpr1a locus. The four linked SNPs that define HI and LO alleles are marked with red bars on the locus. The eight polyCpGs covered in bis-seq assay are labelled a–h (modified from [24]). (b) Per cent polyCpGs/total CpG in the enhancer is compared with the rest of the locus. (c) Density of polyCpGs (polyCpGs per 100 bp) within enhancer compared with rest of locus. (d) For each polyCpG Pearson's correlation coefficient is calculated between RSC-V1aR abundance and total % DNA methylation (top), genotype (middle), and %methylation per CpG allele (bottom). Cells with p ≤ 0.05 are outlined with a white border. (e) Left, Nissl image and atlas of mouse brain at the retrosplenial area (RSP). Centre, prairie vole autoradiogram shows V1aR abundance at the retrosplenial cortex (RSC). Right, antisense RNA in situ staining shows expression of GATA2 in the retrosplenial area of mouse (Image credit: Allen Institute. © 2015 Allen Institute for Brain Science. Allen Mouse Brain Atlas. Available from: http://mouse.brain-map.org/gene/show/14237). *p ≤ 0.05 and ***p ≤ 0.001.

