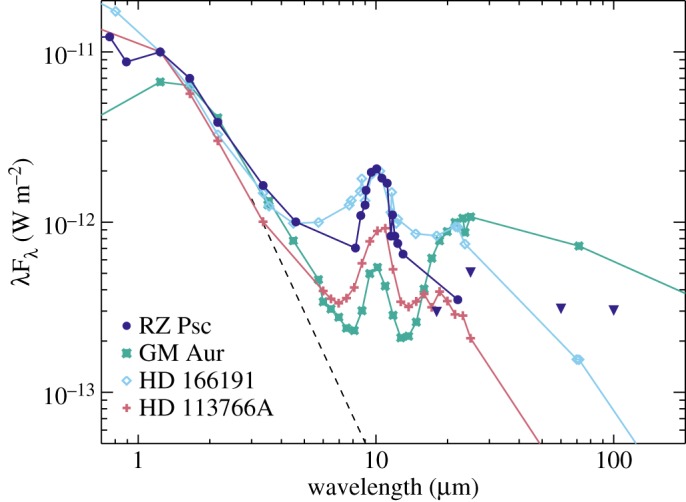
Figure 10.

The spectral energy distribution of RZ Psc in comparison with other young disc-hosting stars. All SEDs are normalized to a common flux density at H band. The triangles are AKARI and IRAS upper limits for RZ Psc. Measurements were made at different times, so the apparent discrepancy between the WISE detection at 22 μm and the AKARI upper limit at 18μm is an indicator of IR variability (see §3.2).
