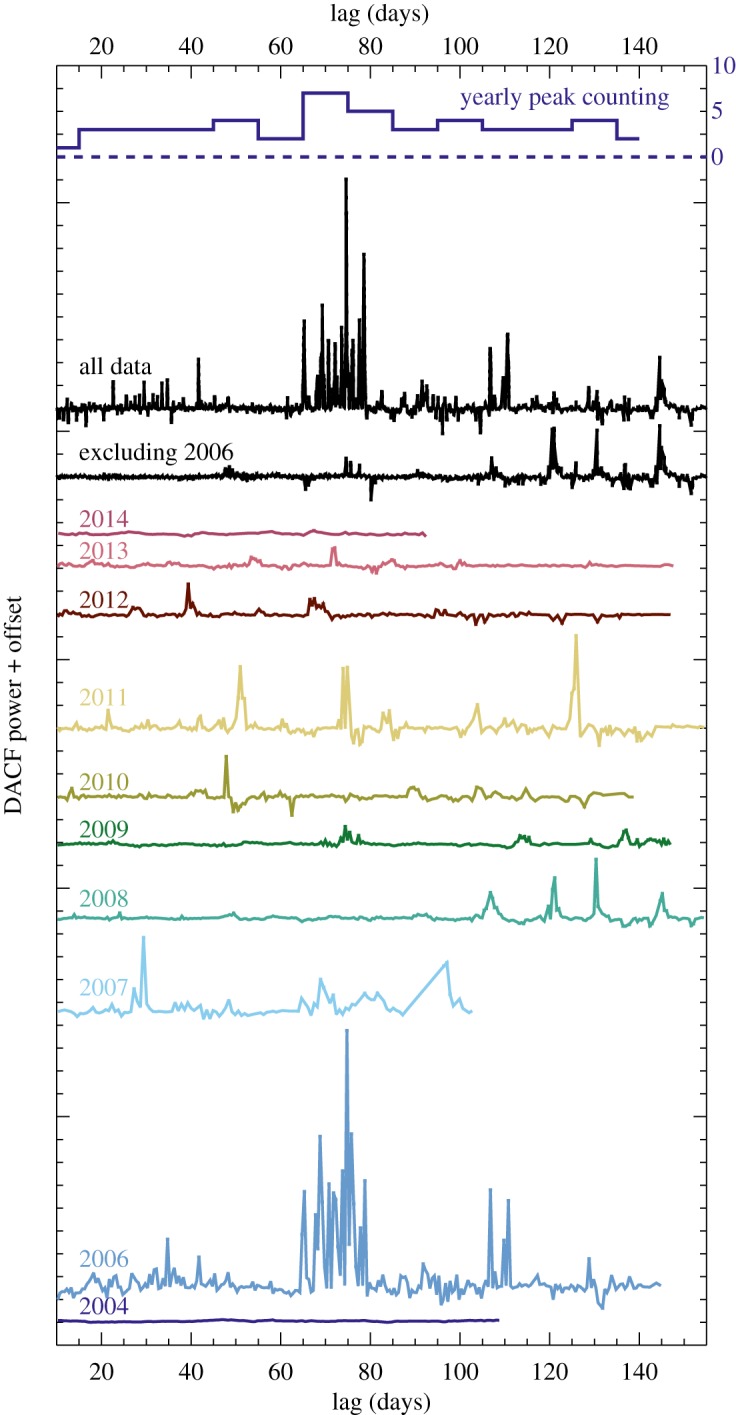
Figure 5.

Discrete autocorrelation function for yearly WASP and KELT-North data, computed for lags between 10 and 155 days. The second and third lines from the top show all data, and 2006-excluded data. The topmost line shows the number of years that show a peak more than 3σ above the clipped DACF mean within each 5 day bin. The peak at 70 days is 7 years, the dashed line is zero and the y-axis scale is shown to the right.
